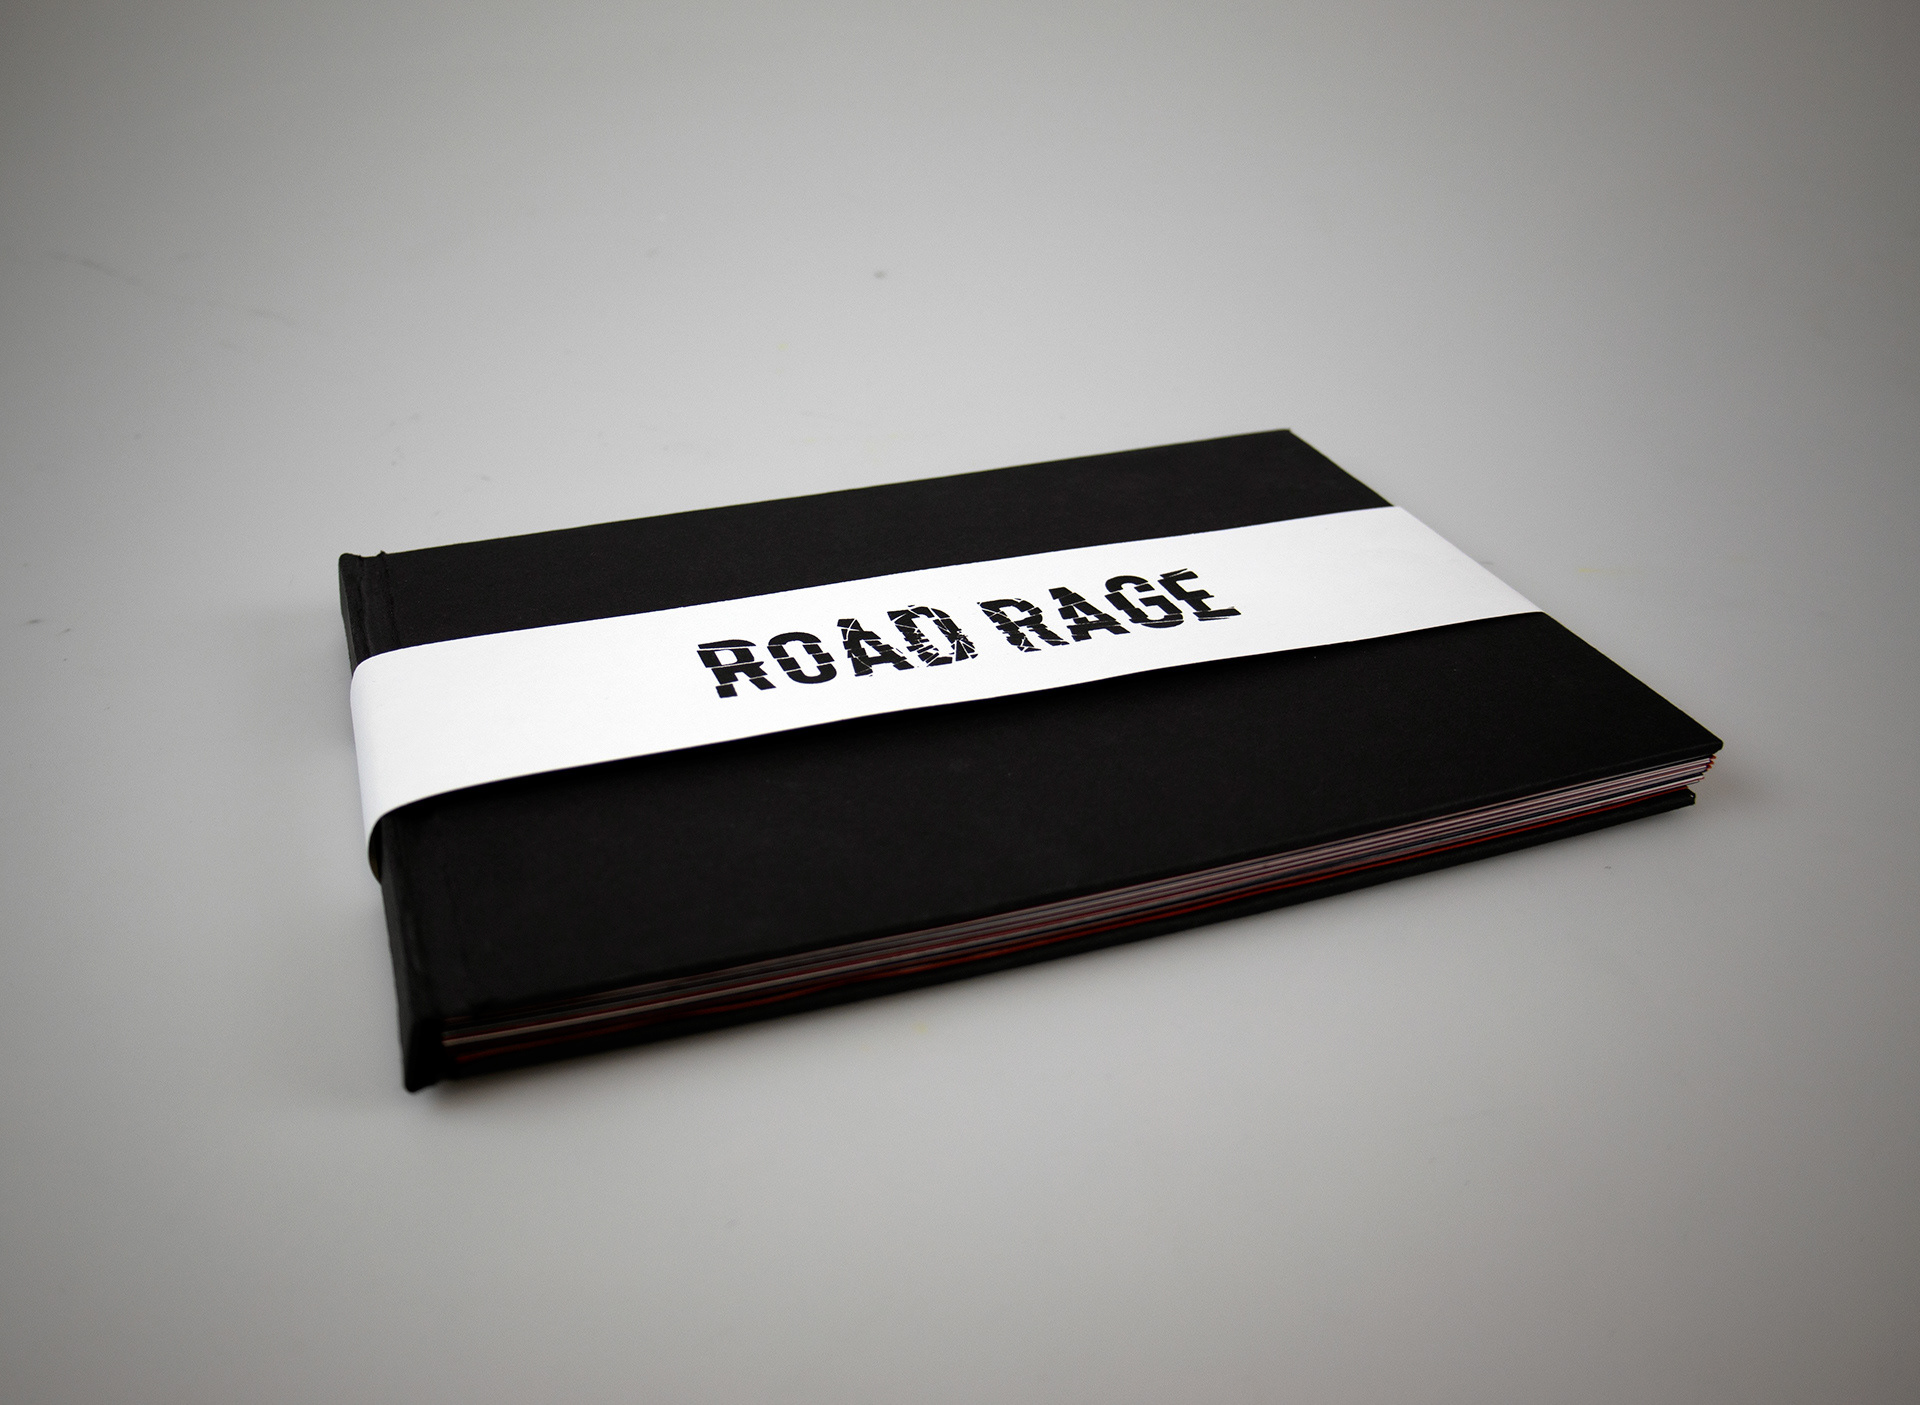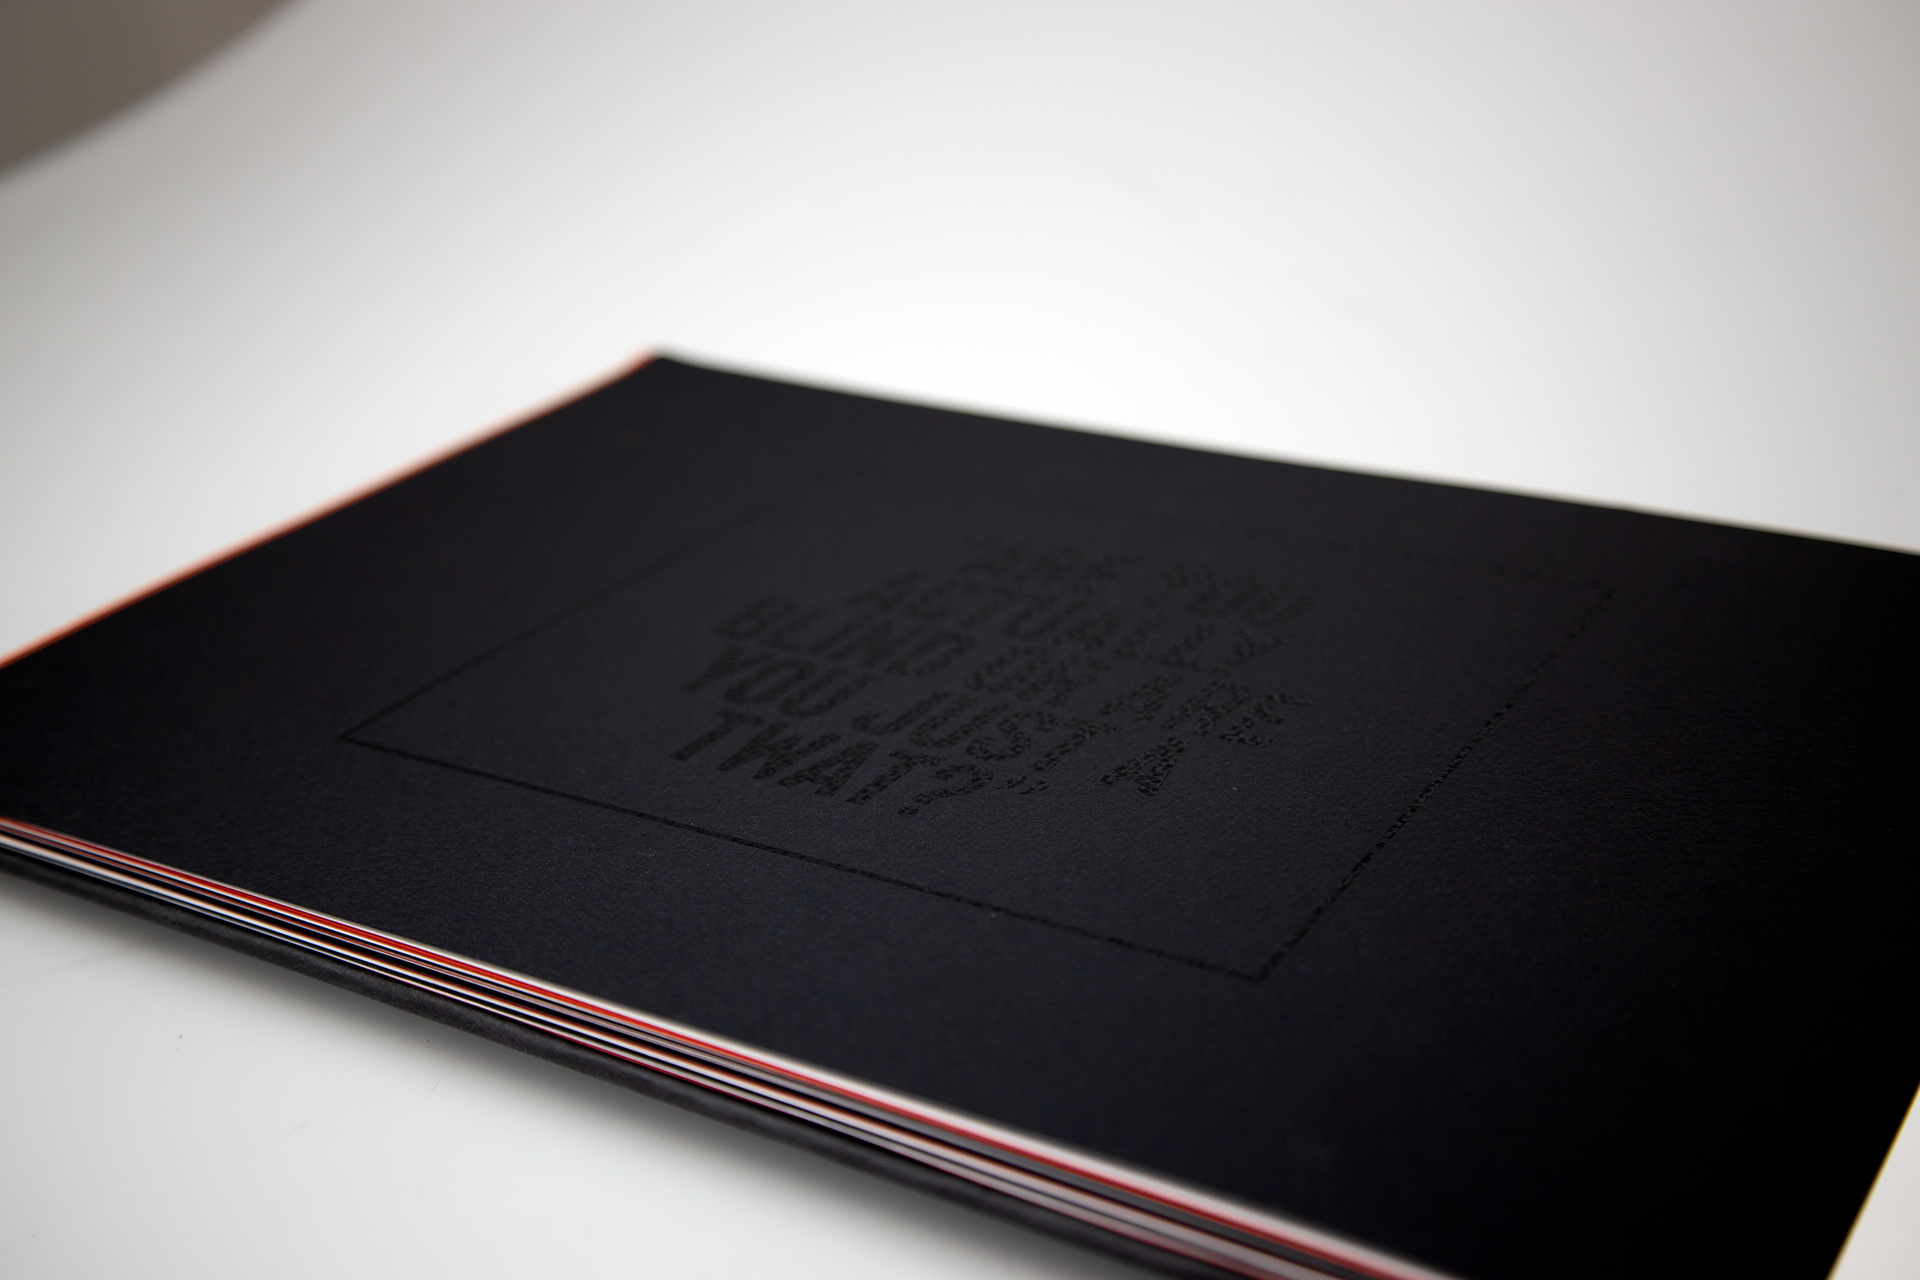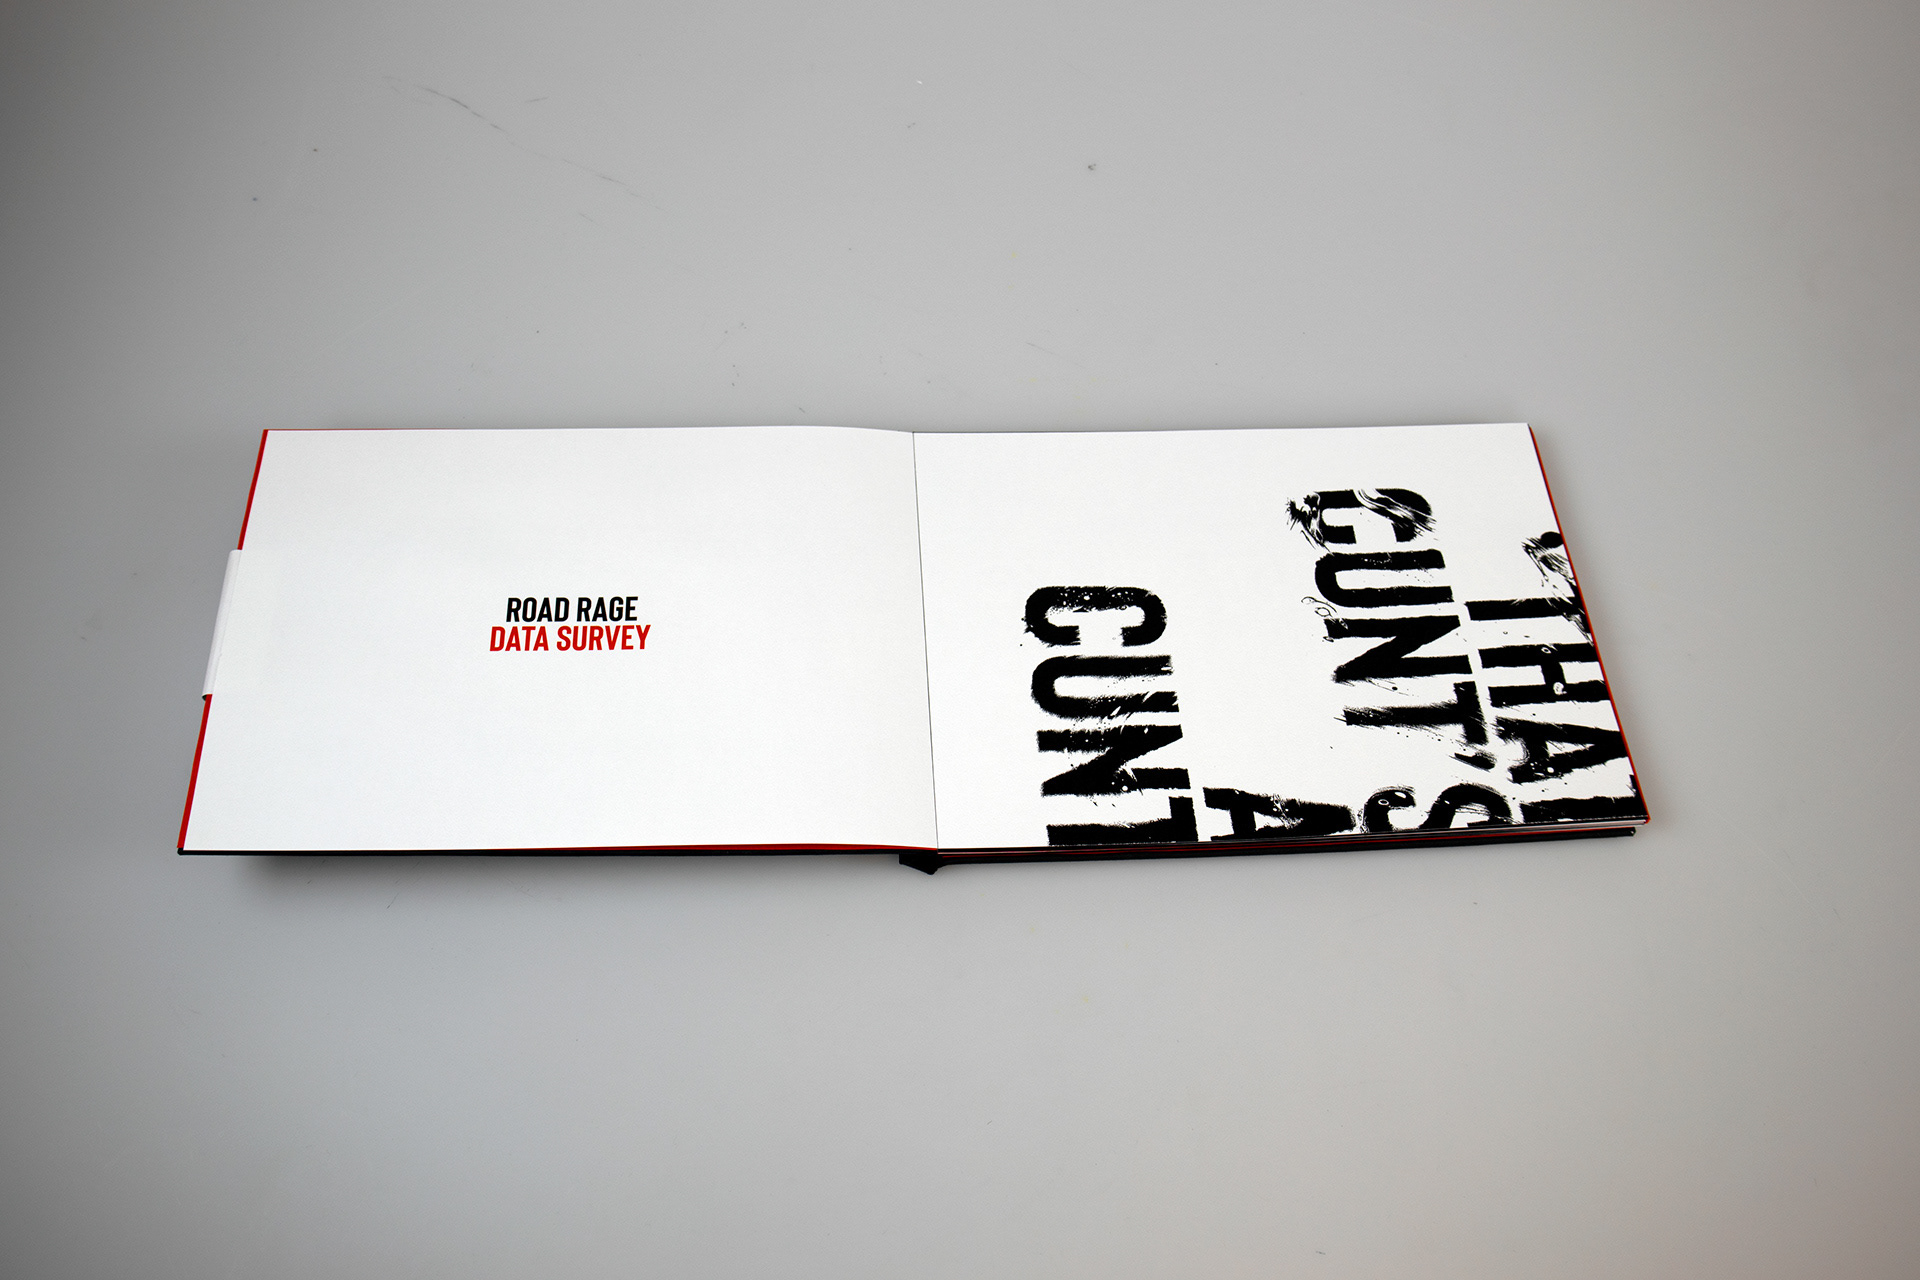
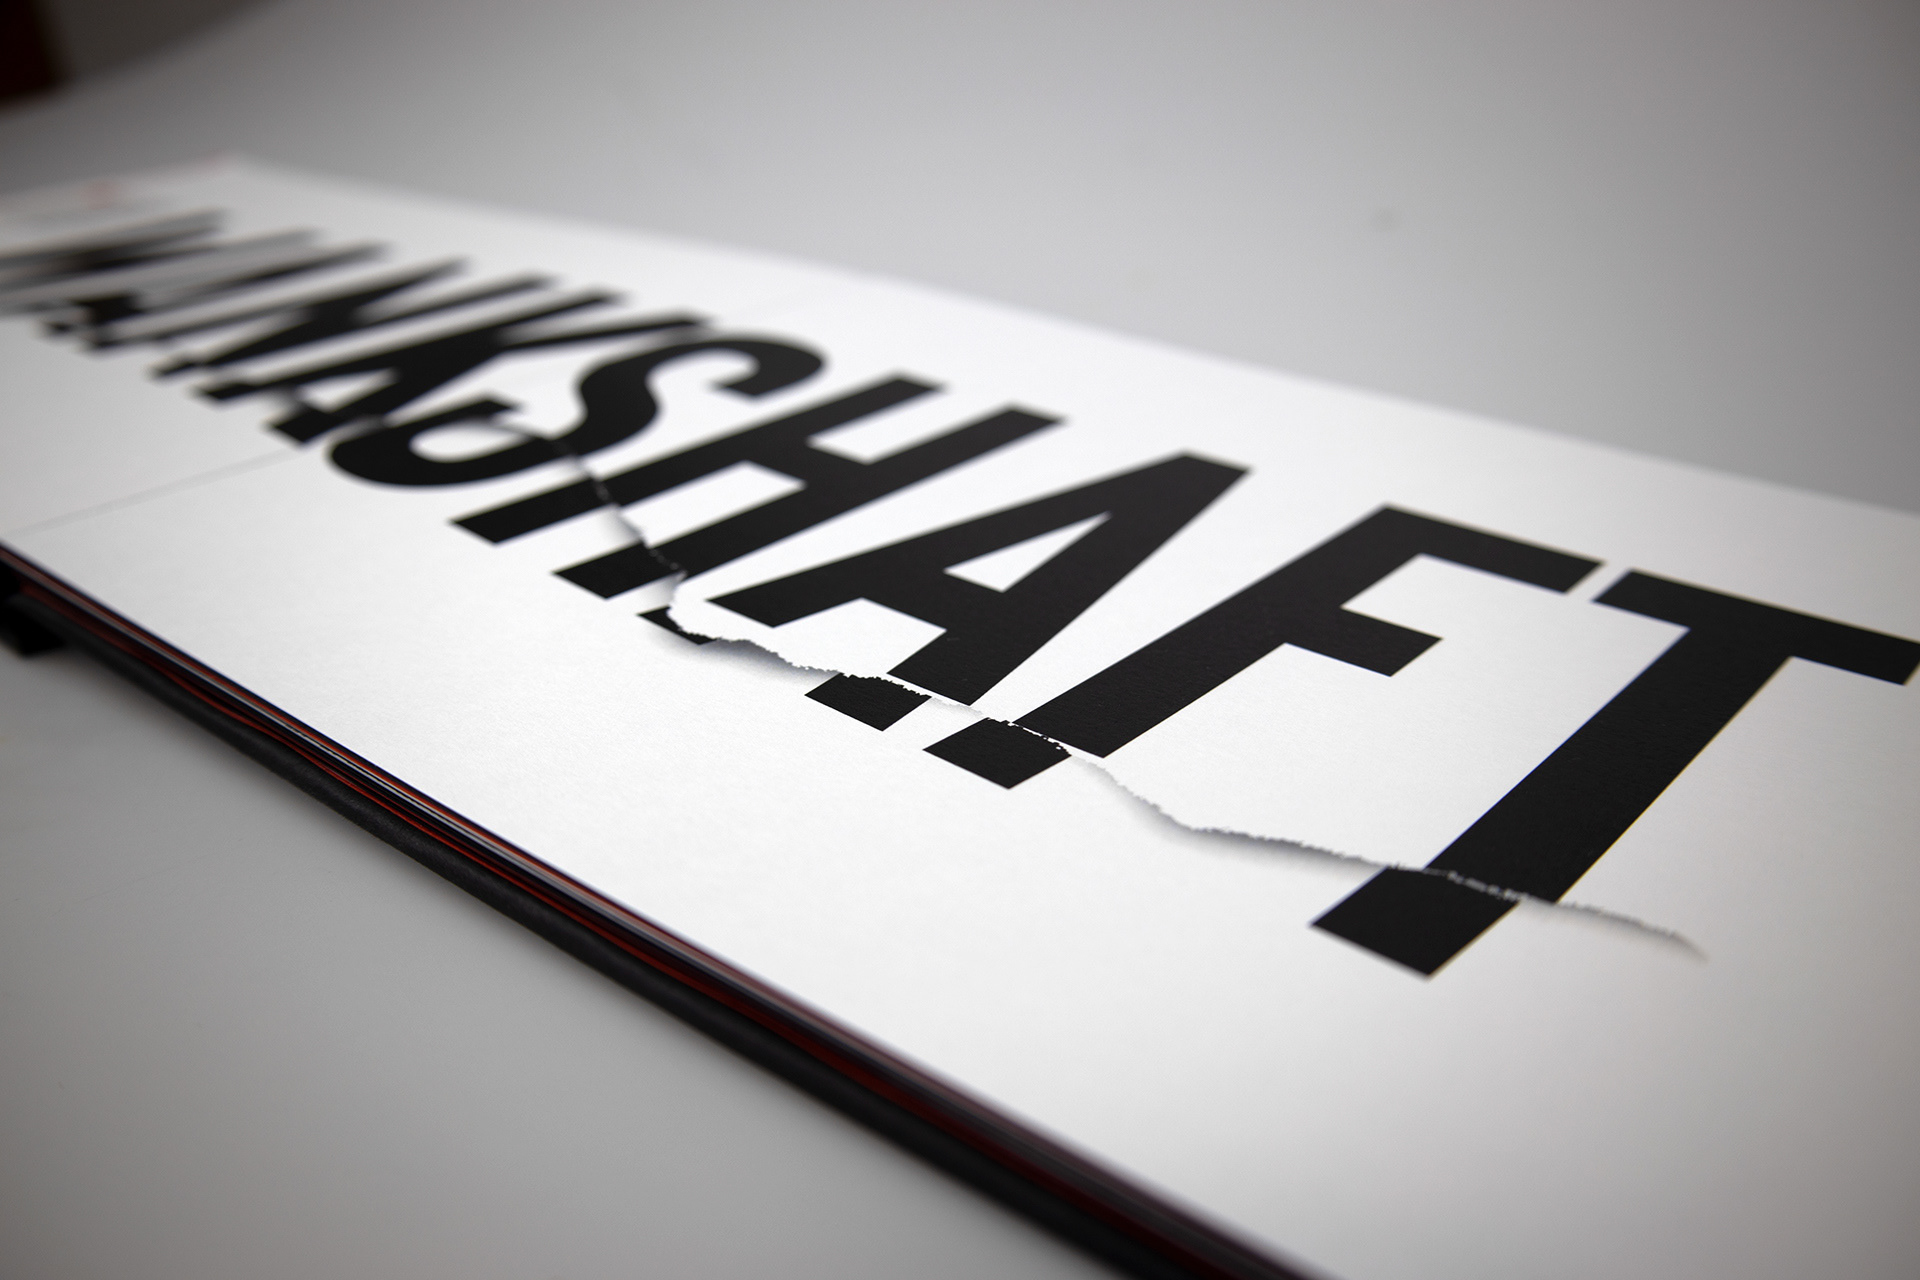
Road Rage
D A T A S U R V E Y P U B L I C A T I O N
Falmouth University, 2021
Background
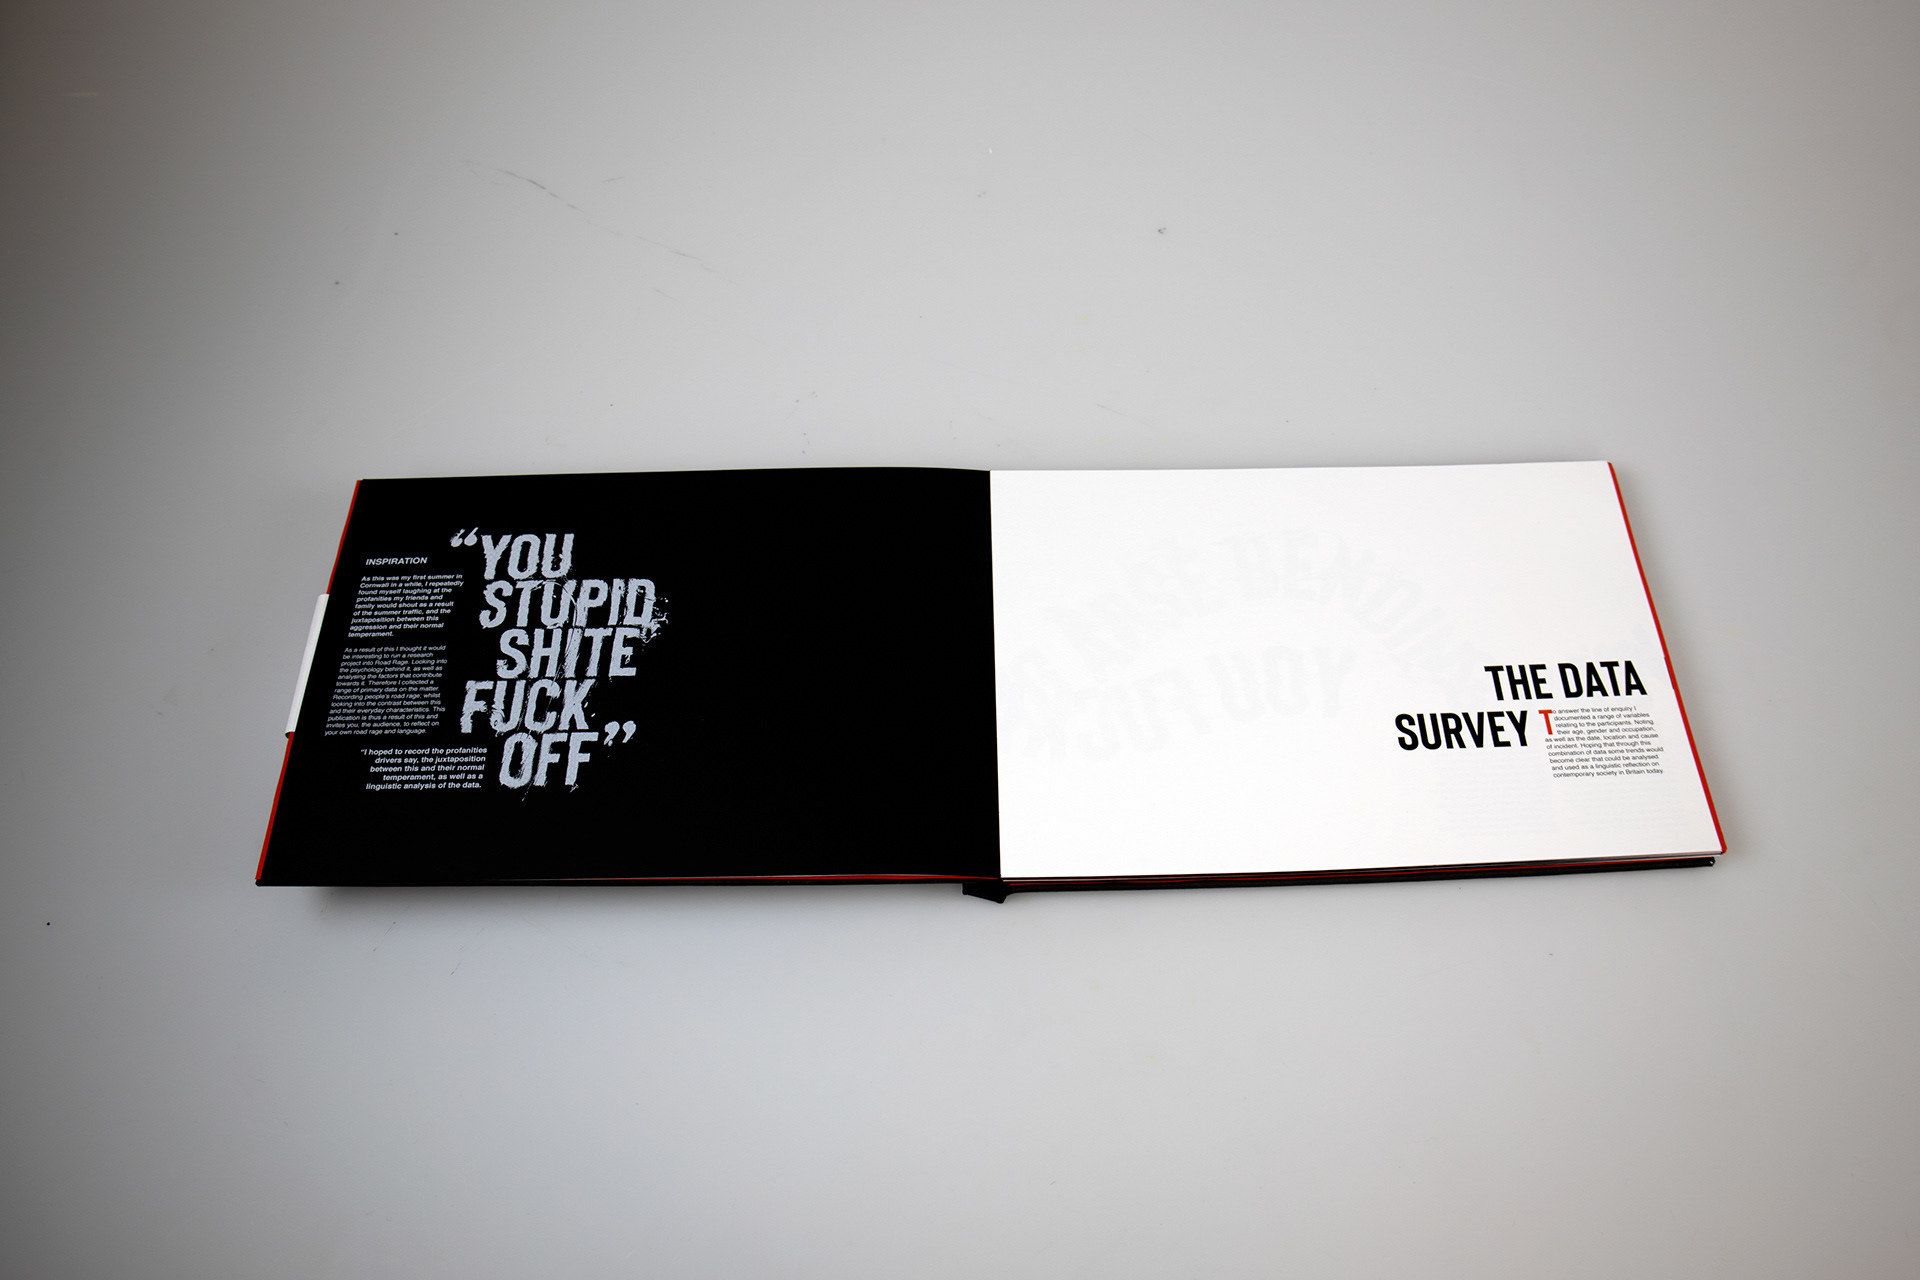
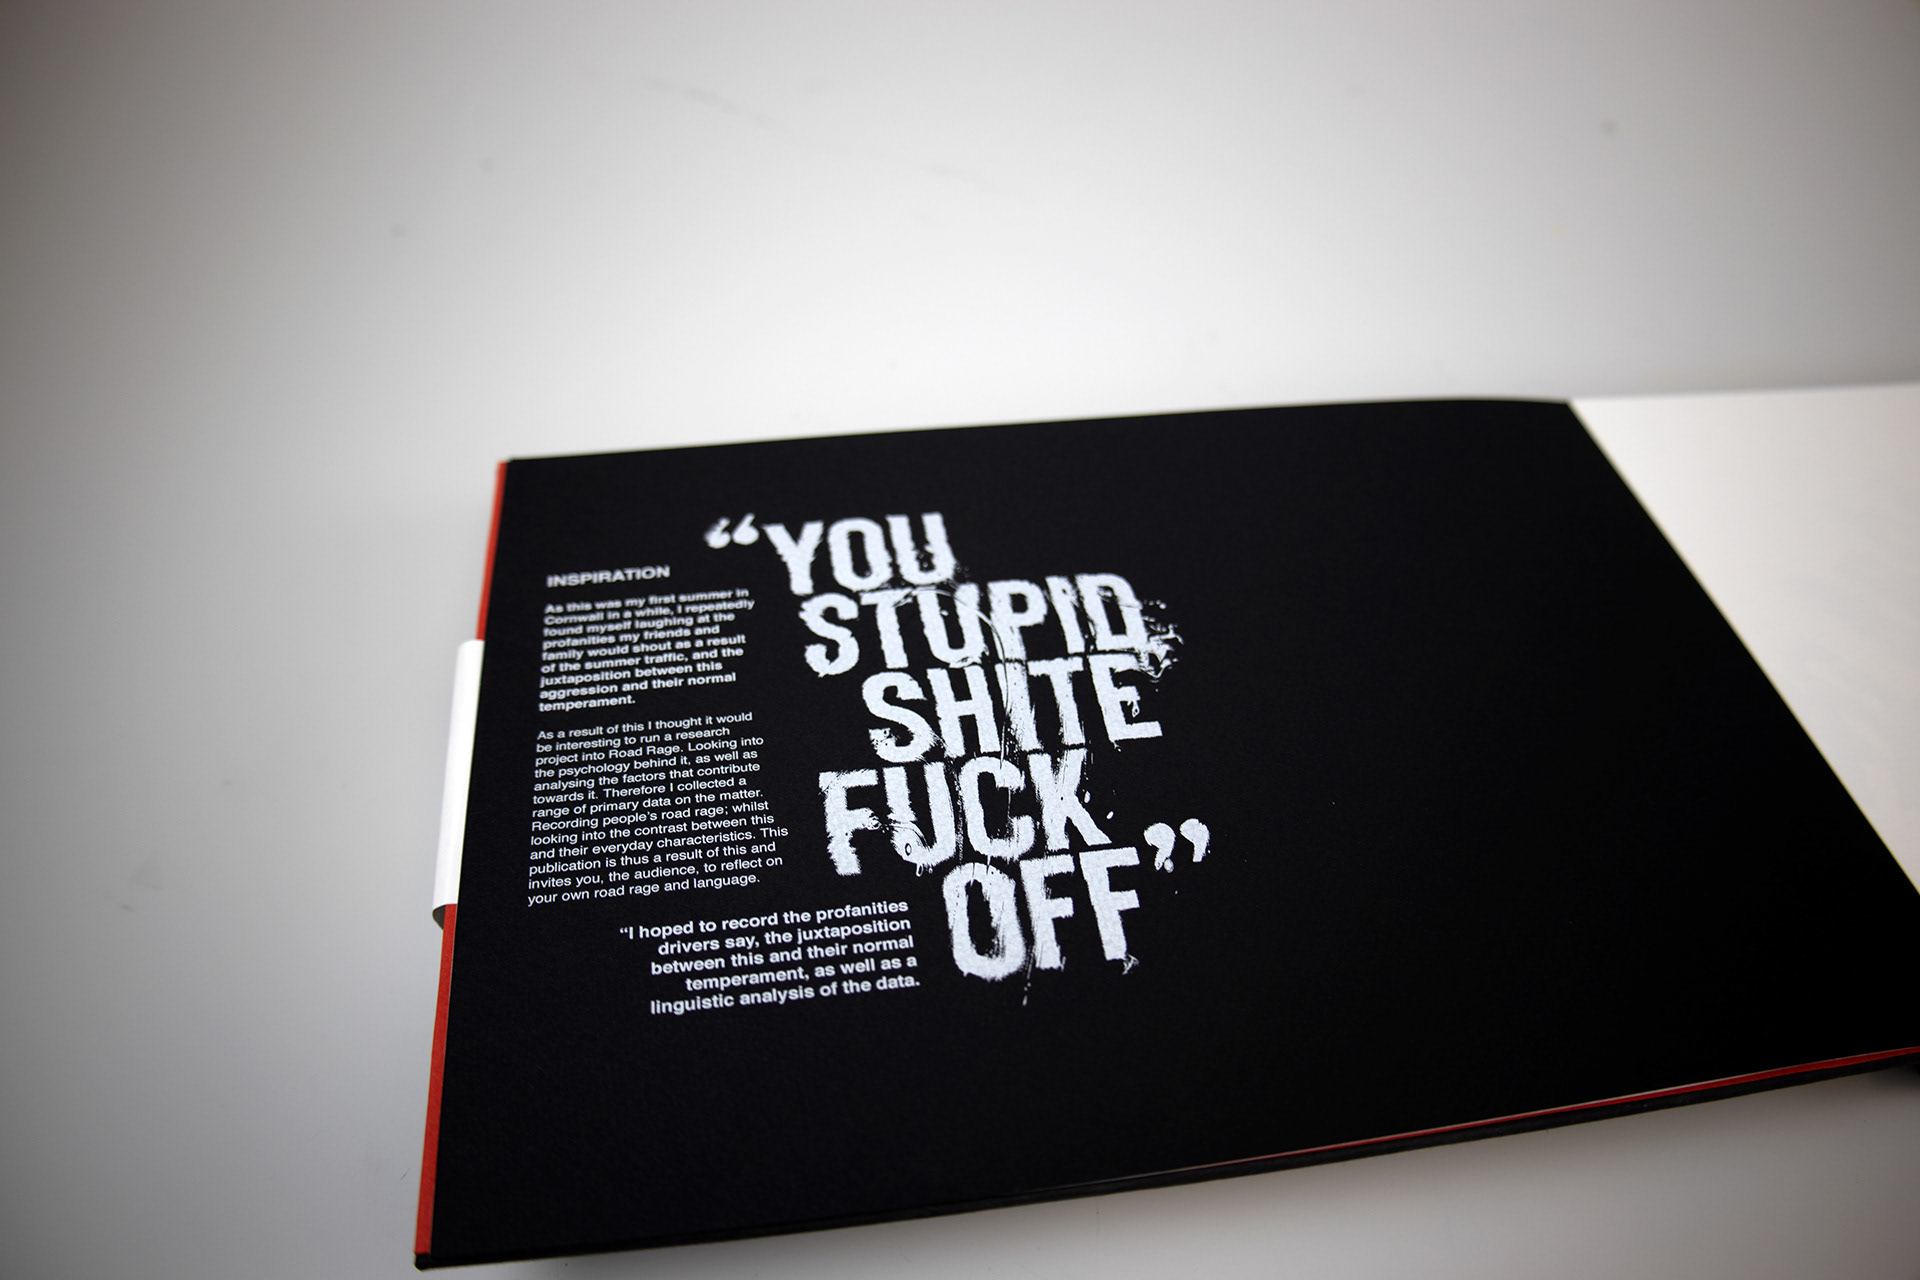
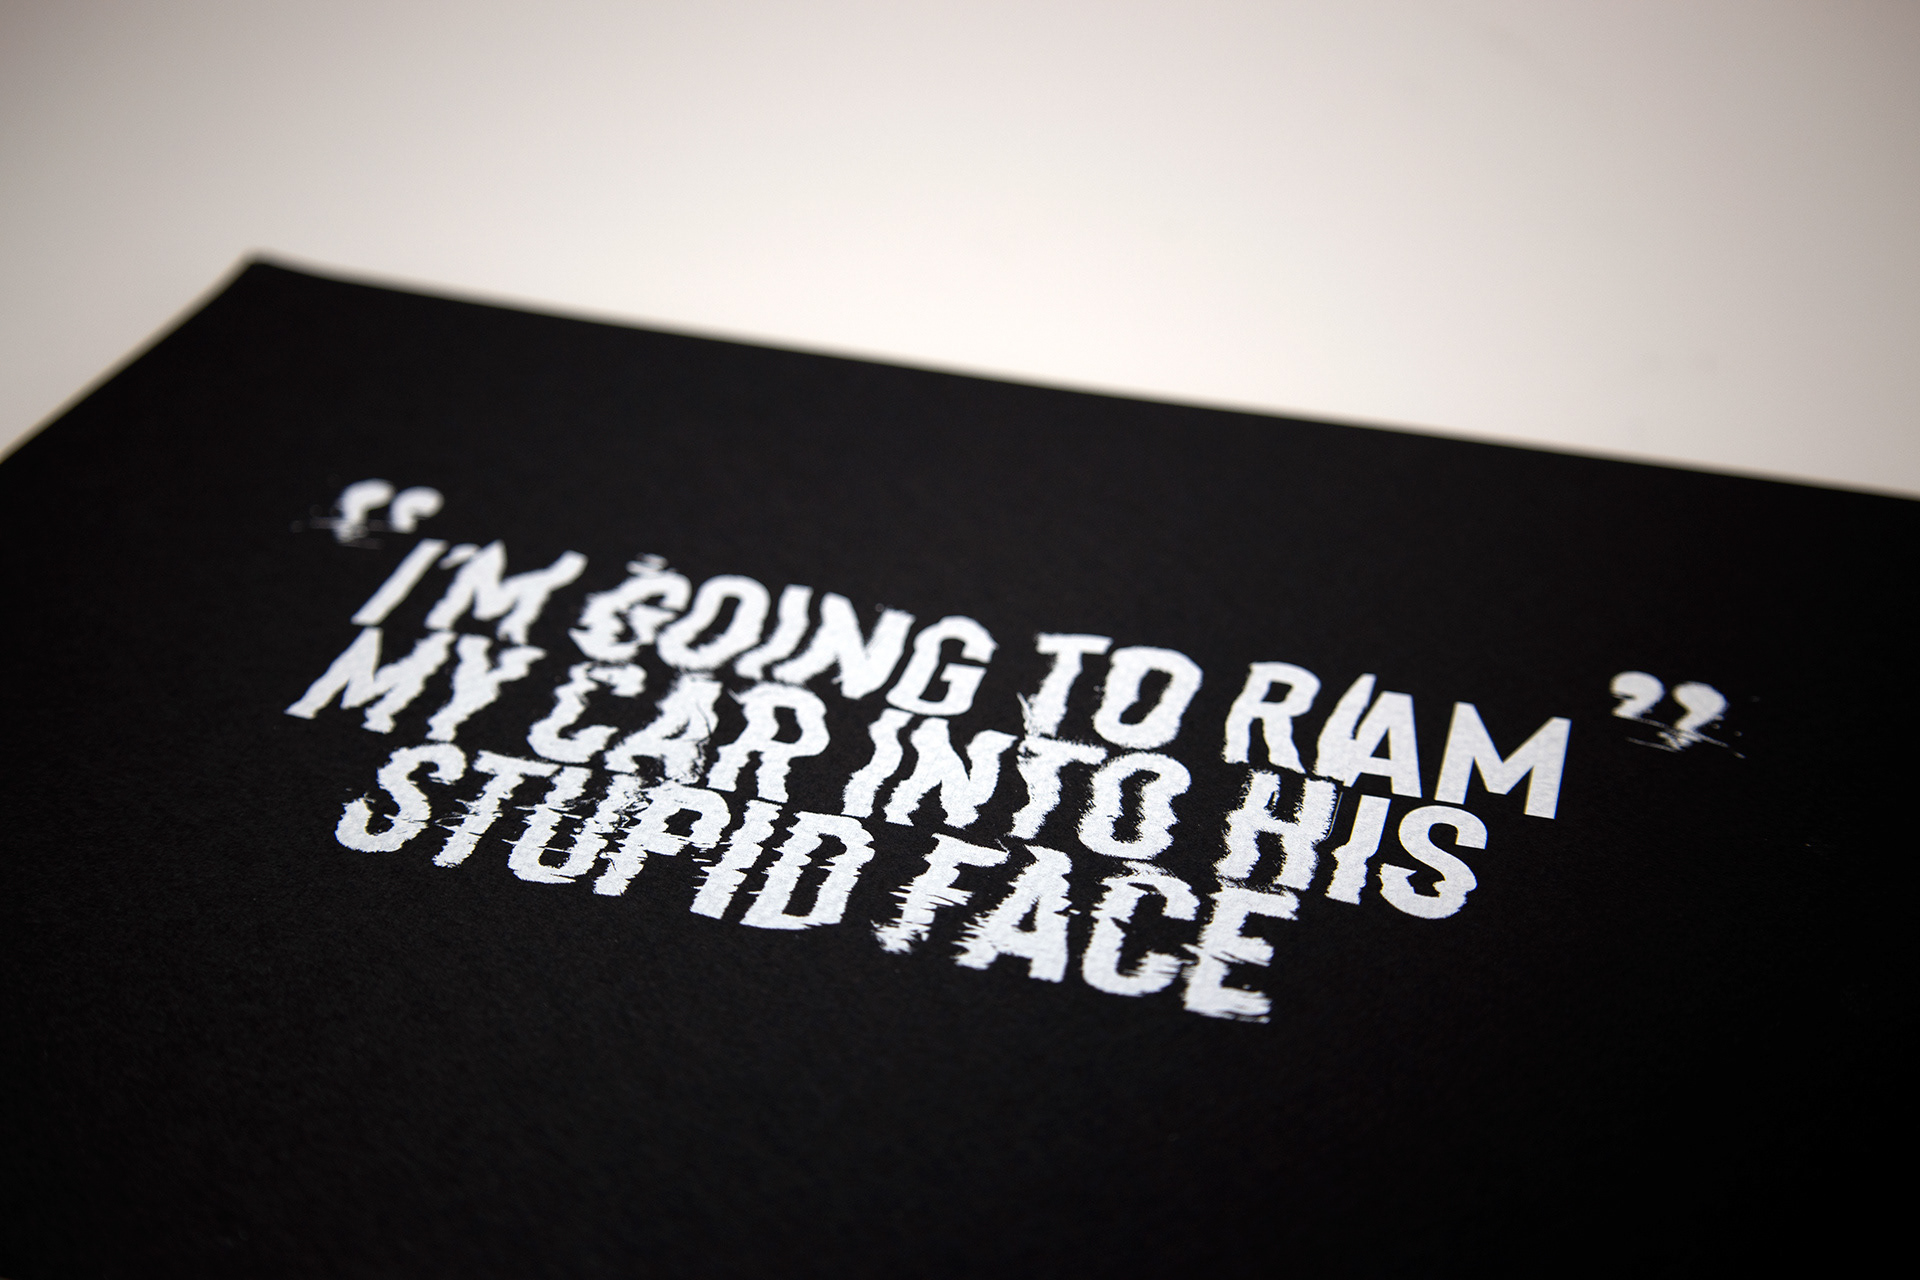
Last summer, I repeatedly found myself laughing at the profanities my friends and family would shout as a result of the summer traffic, and the juxtaposition between this aggression and their normal temperament. As a result of this I thought it would be interesting to run a research project into Road Rage. Looking into the psychology behind it, as well as analysing the factors that contribute towards it.
Brief
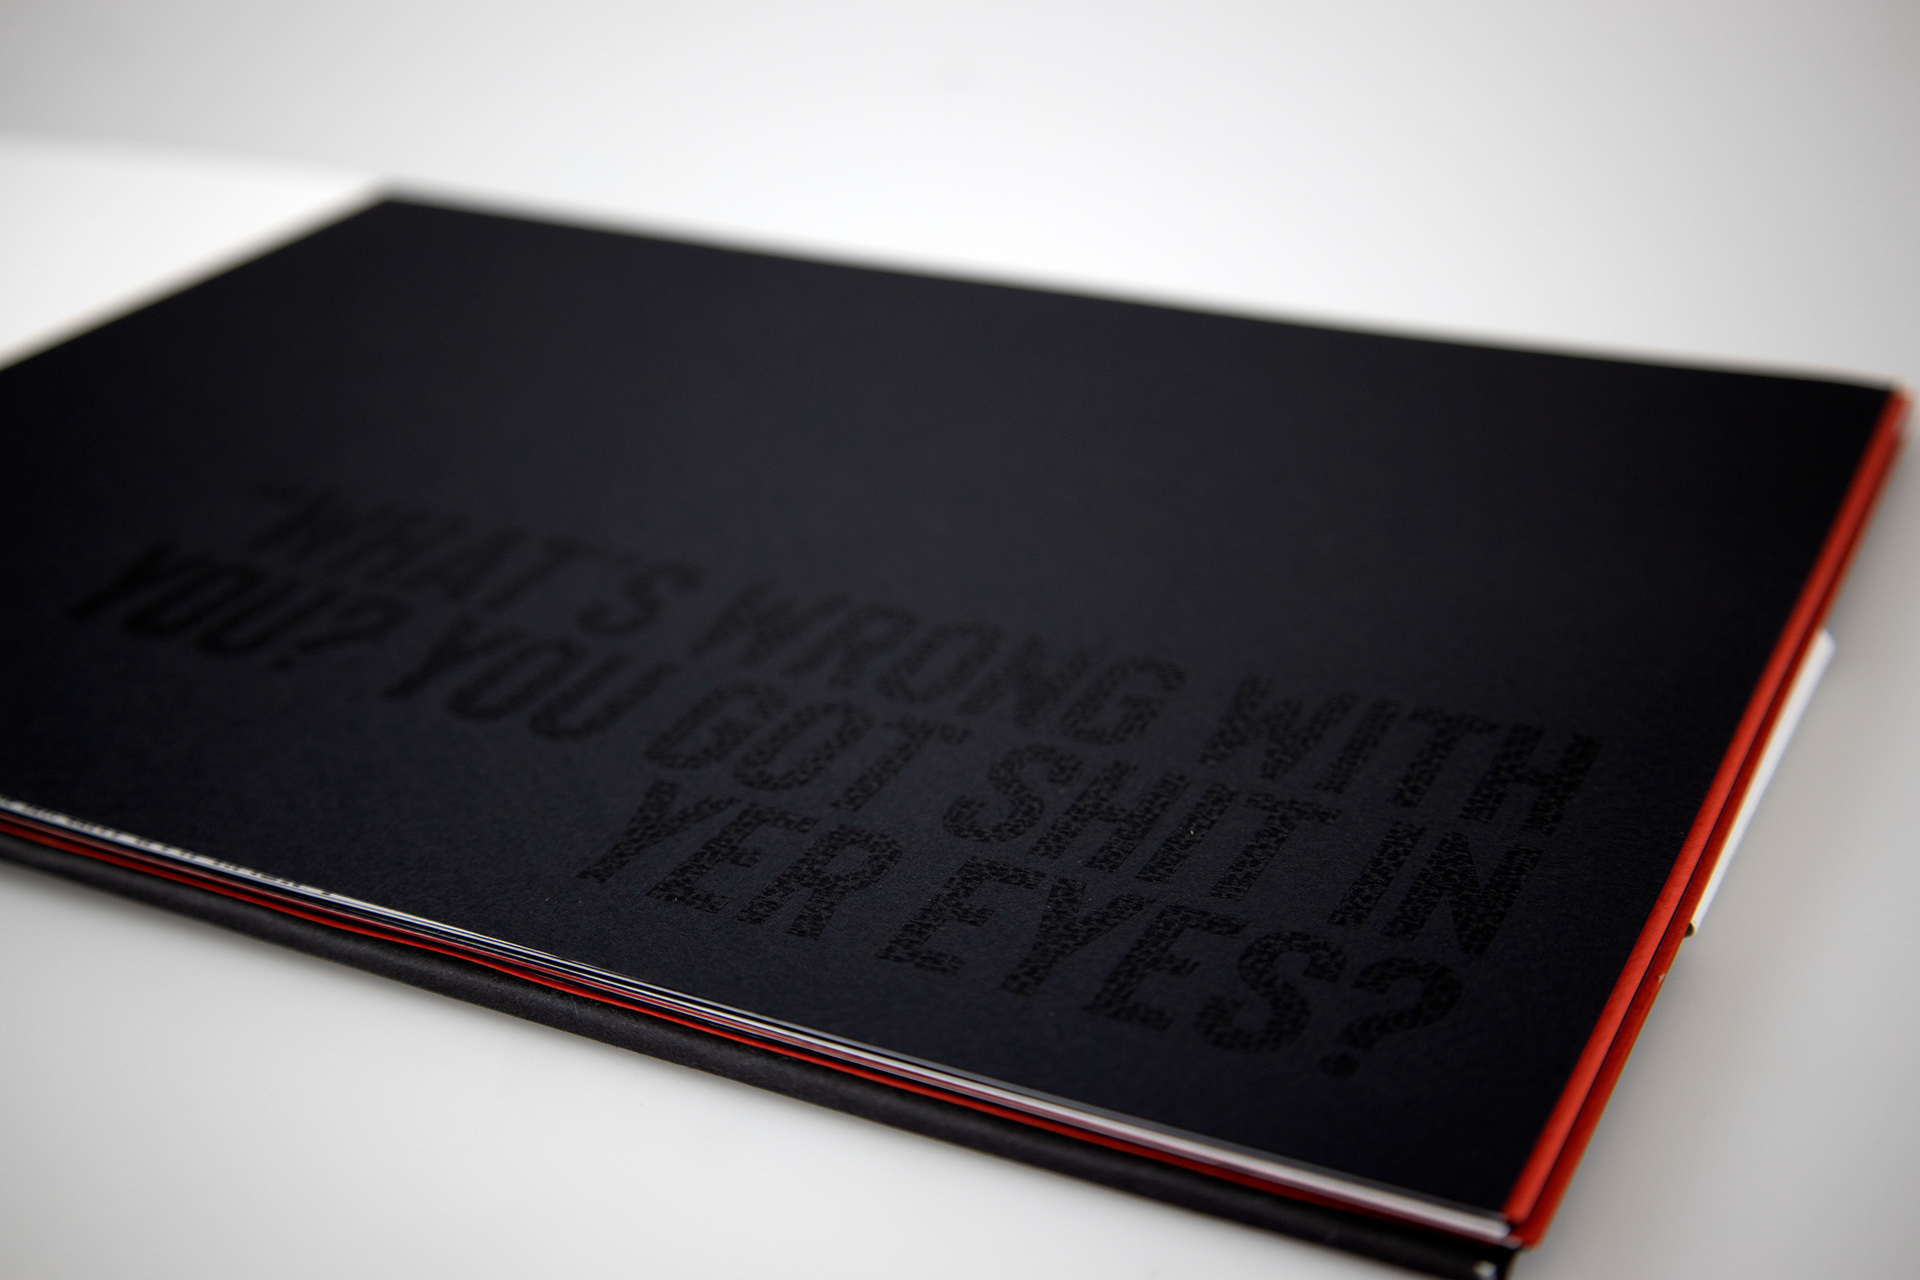
Bring to light the information recorded and analysed in the survey through an outcome that will invite the audience to reflect on their own road rage and the absurdity of it. At the same point, define a path that will focus on typography, editorial design and data handling in a clearly established manner.
Outcome
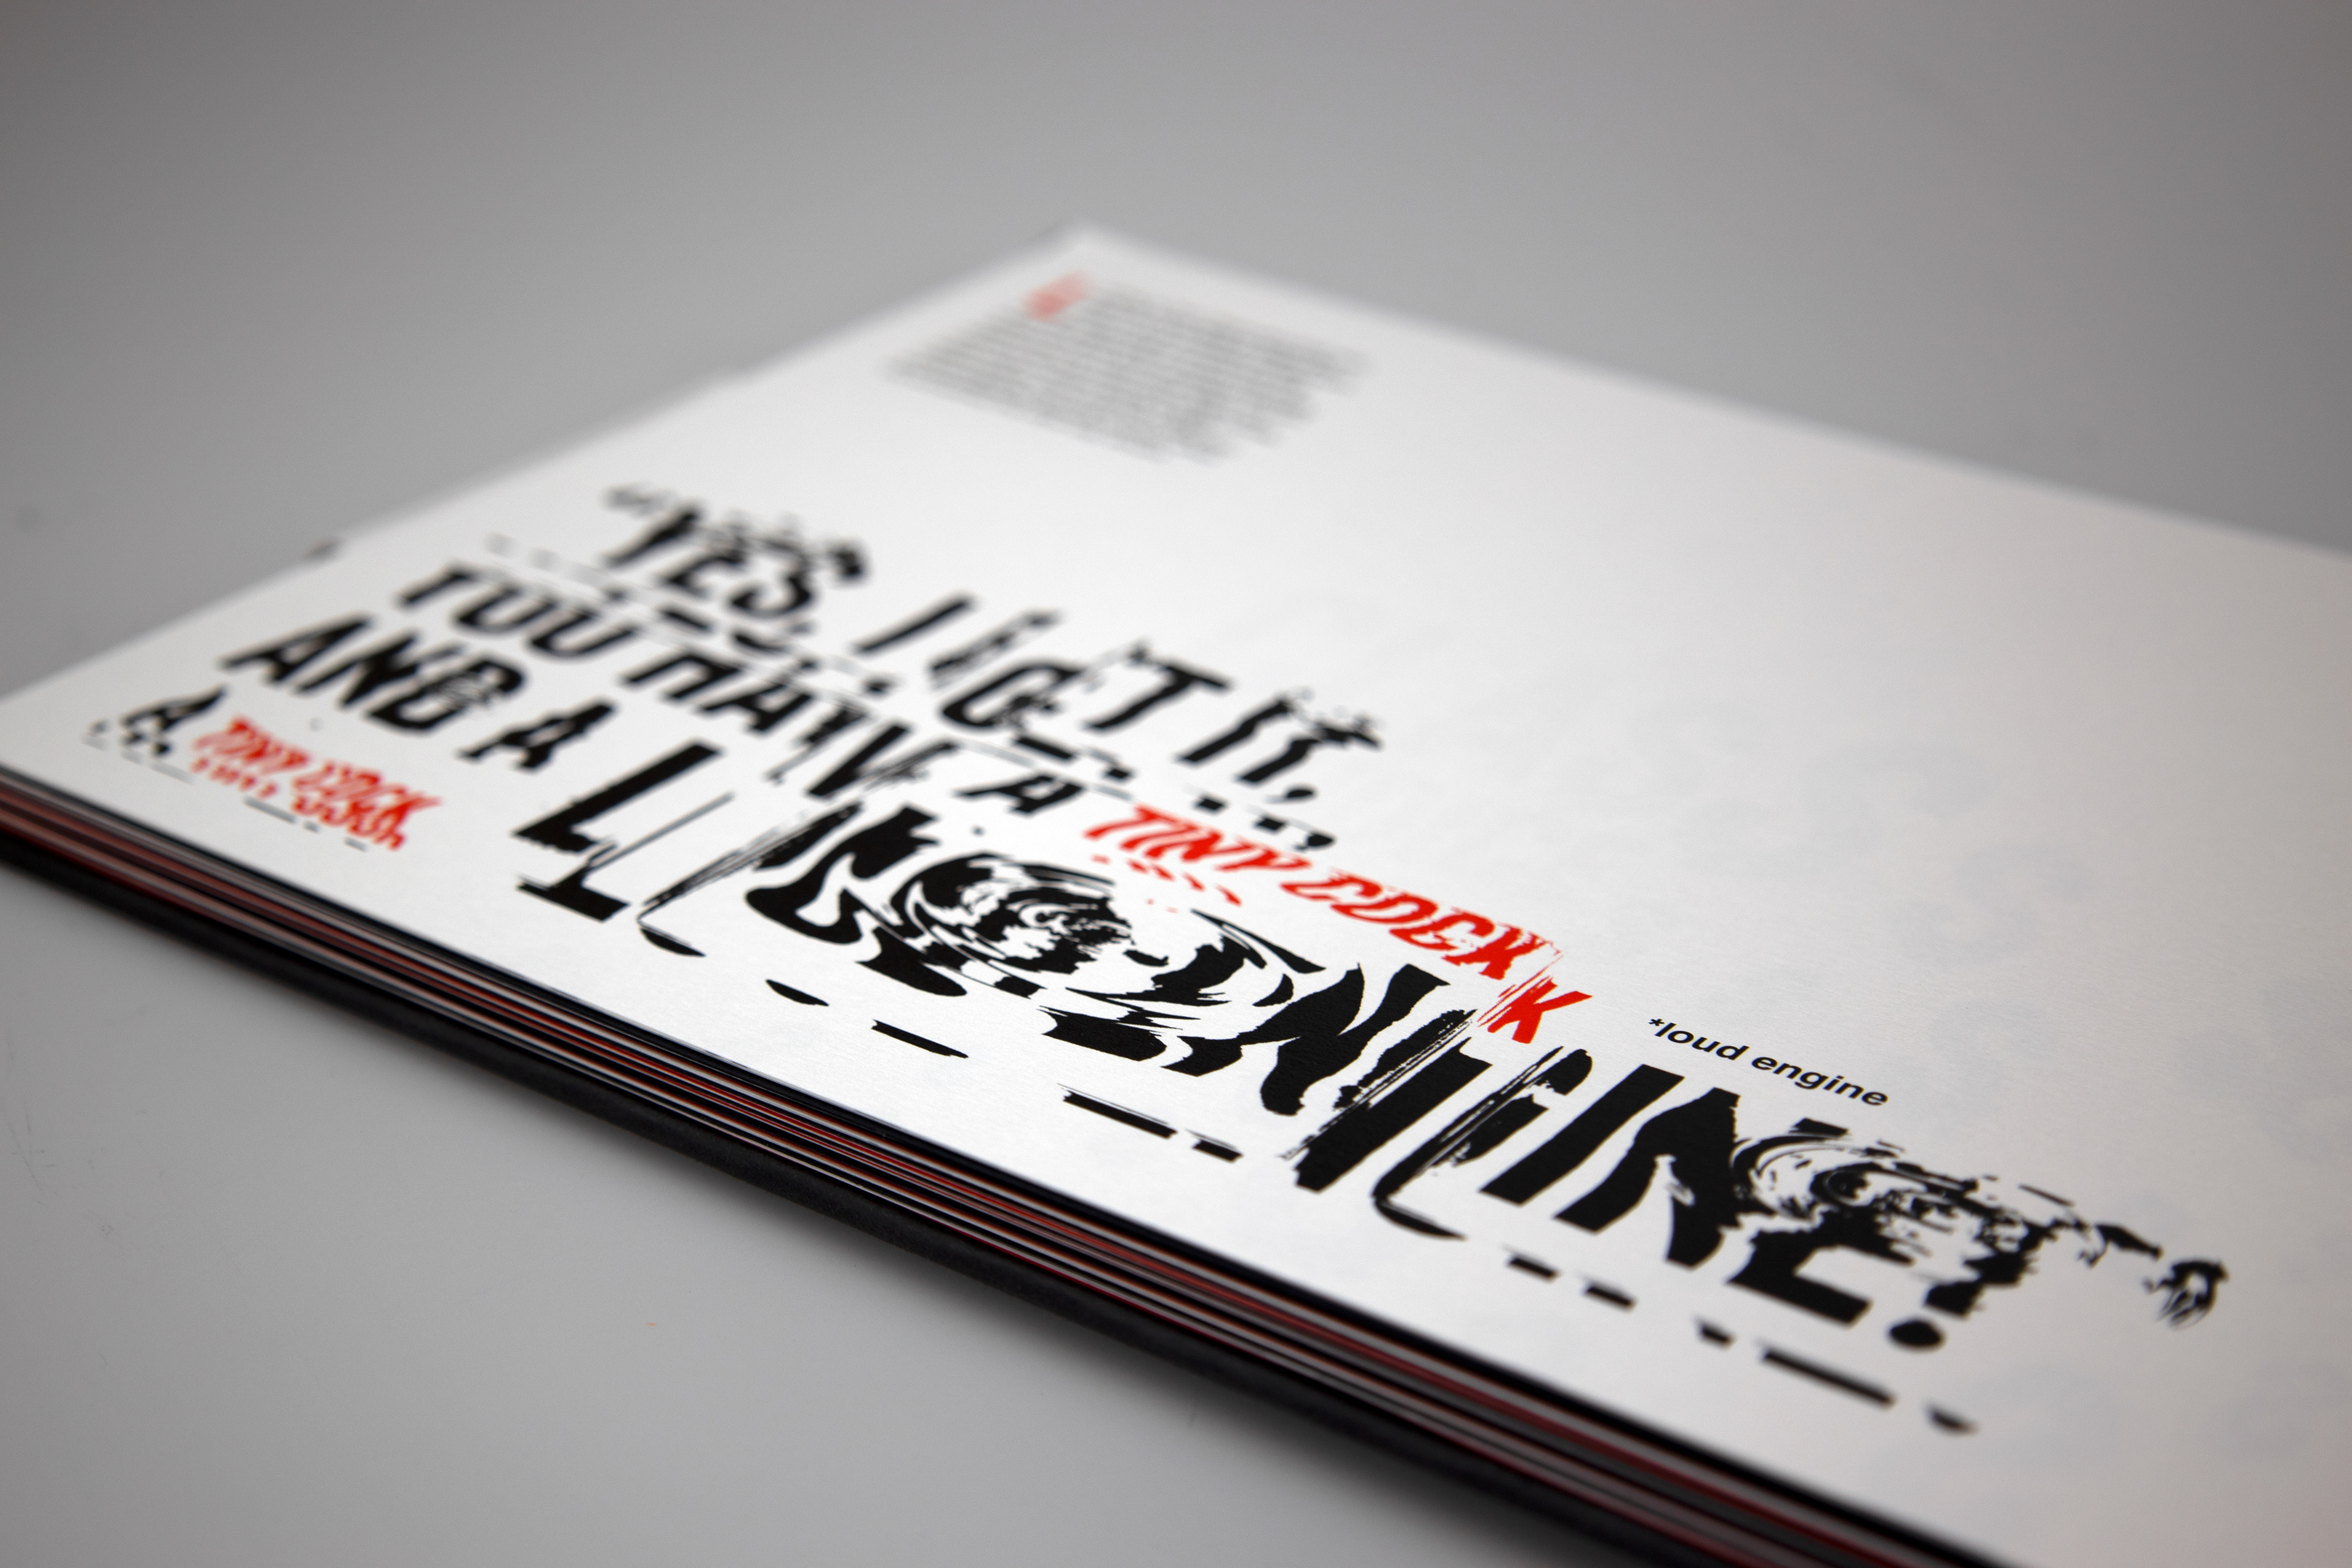
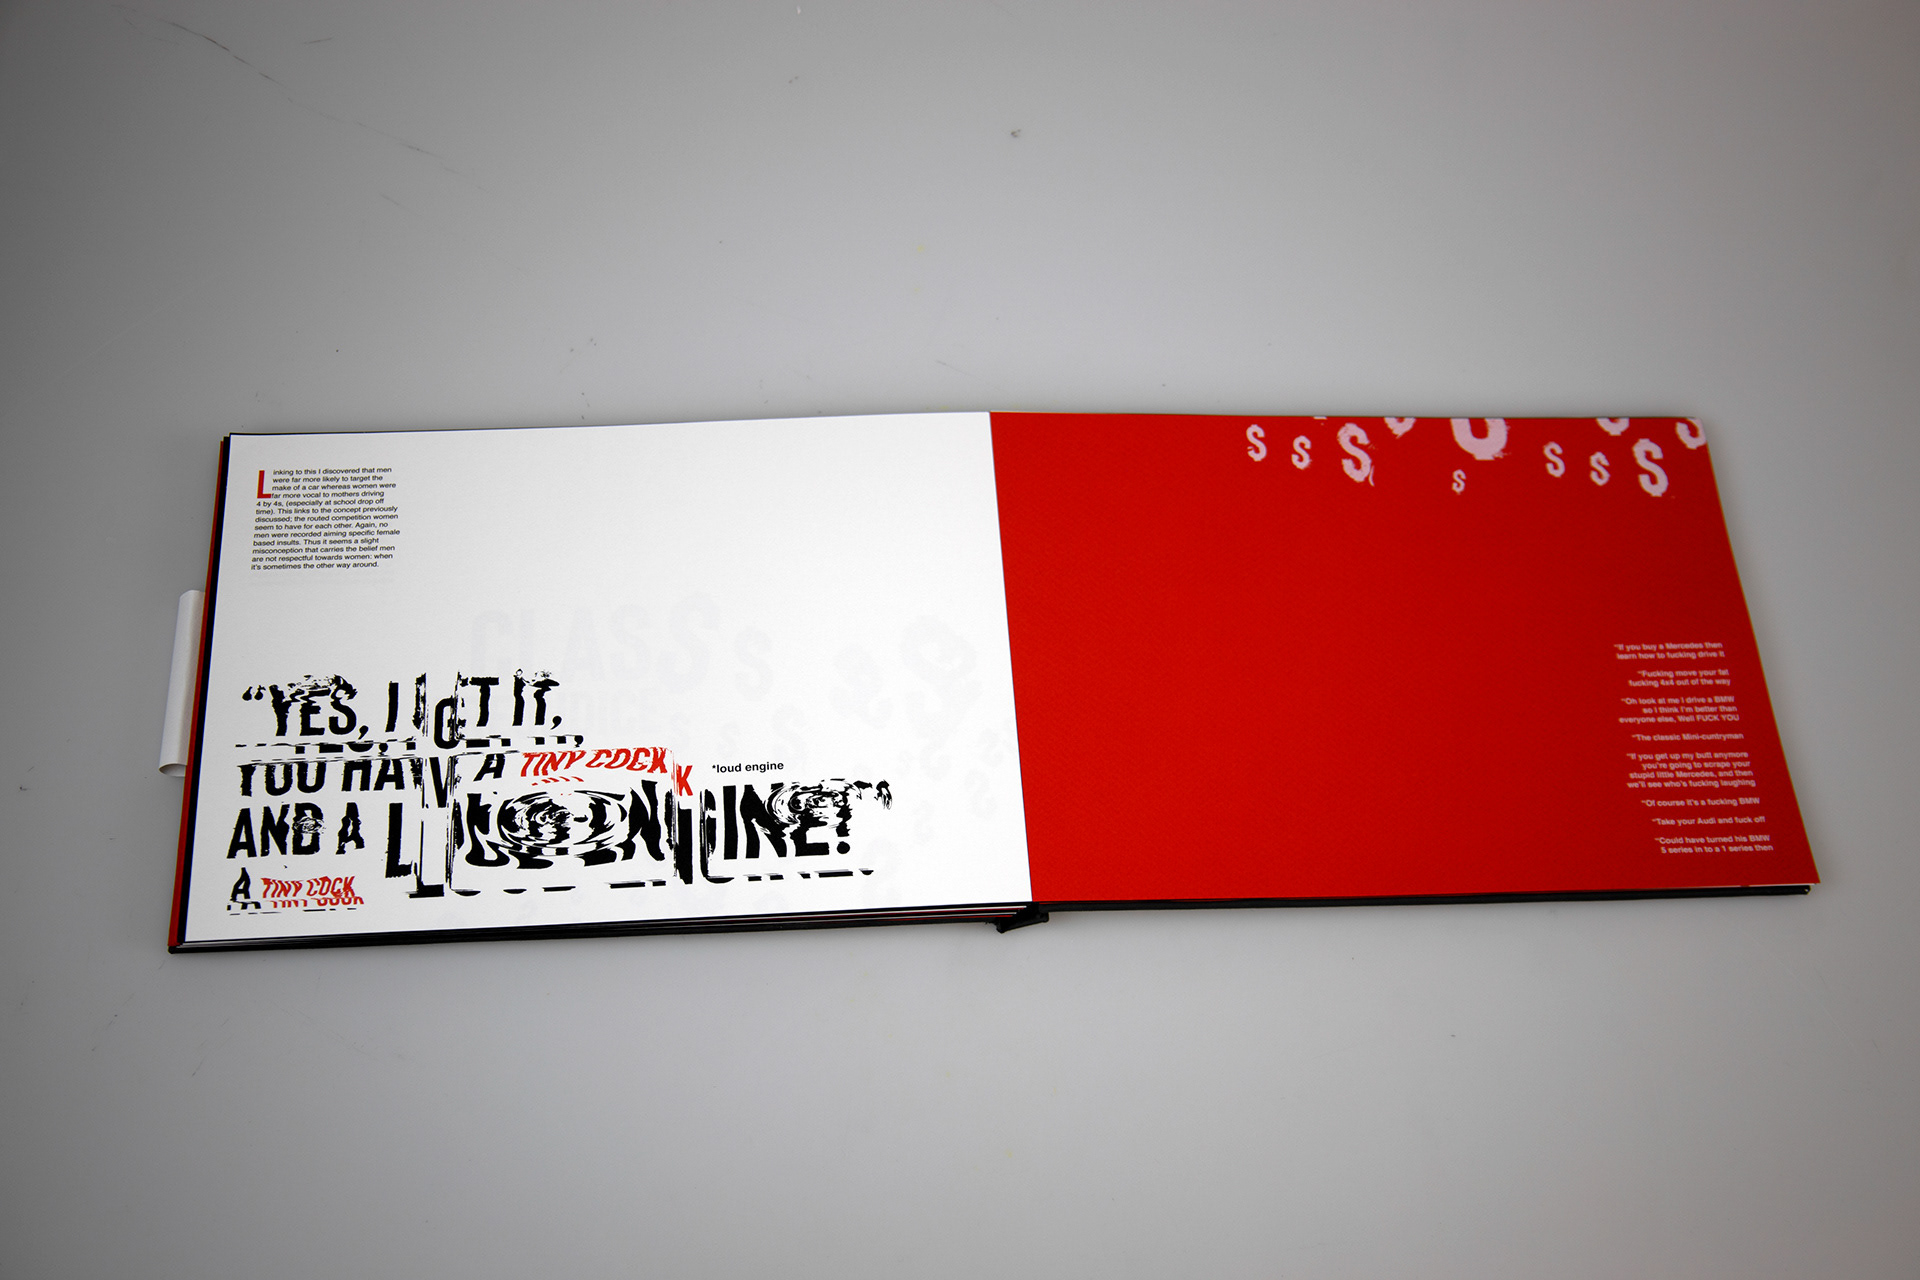
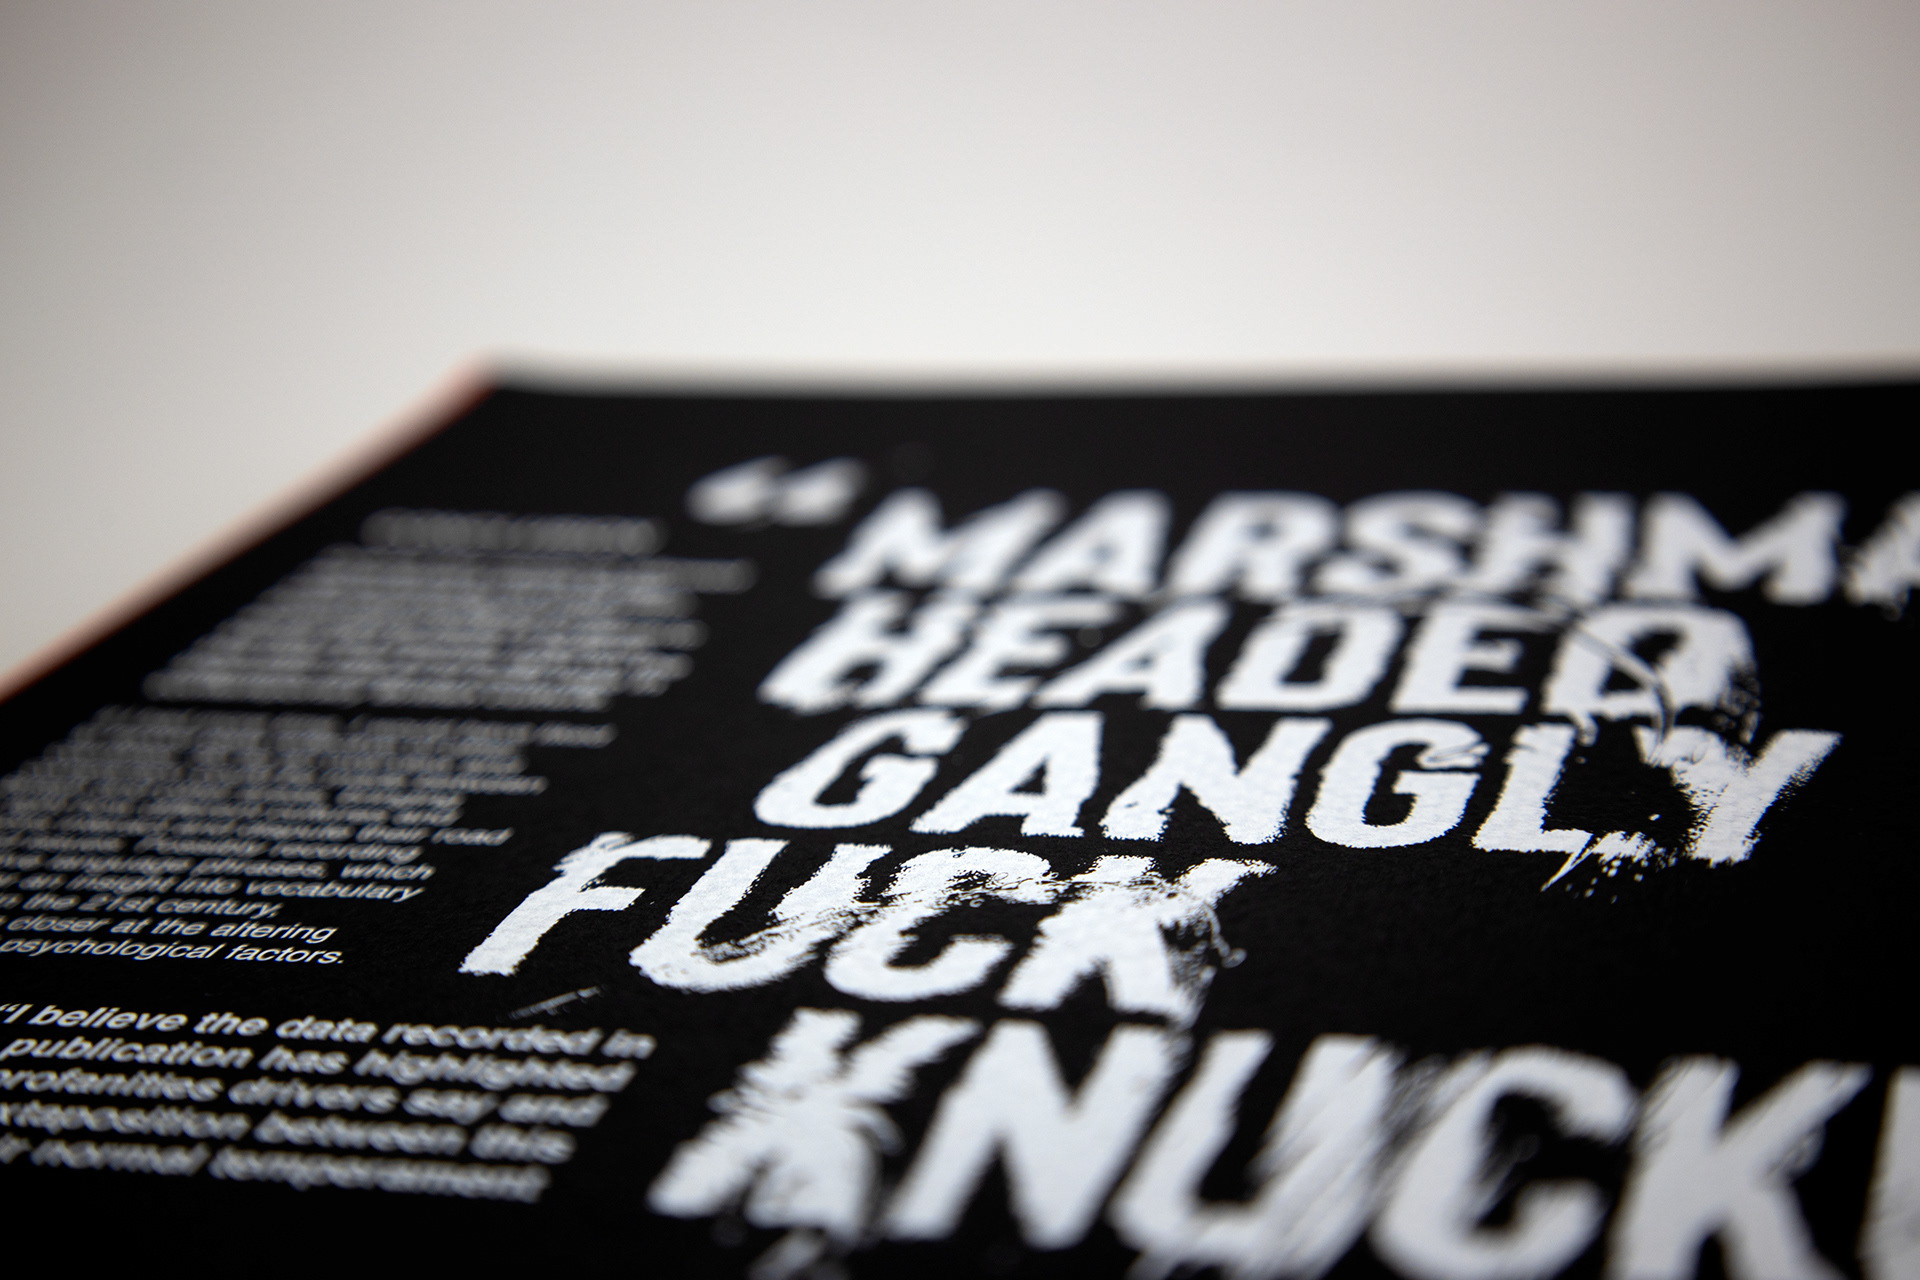
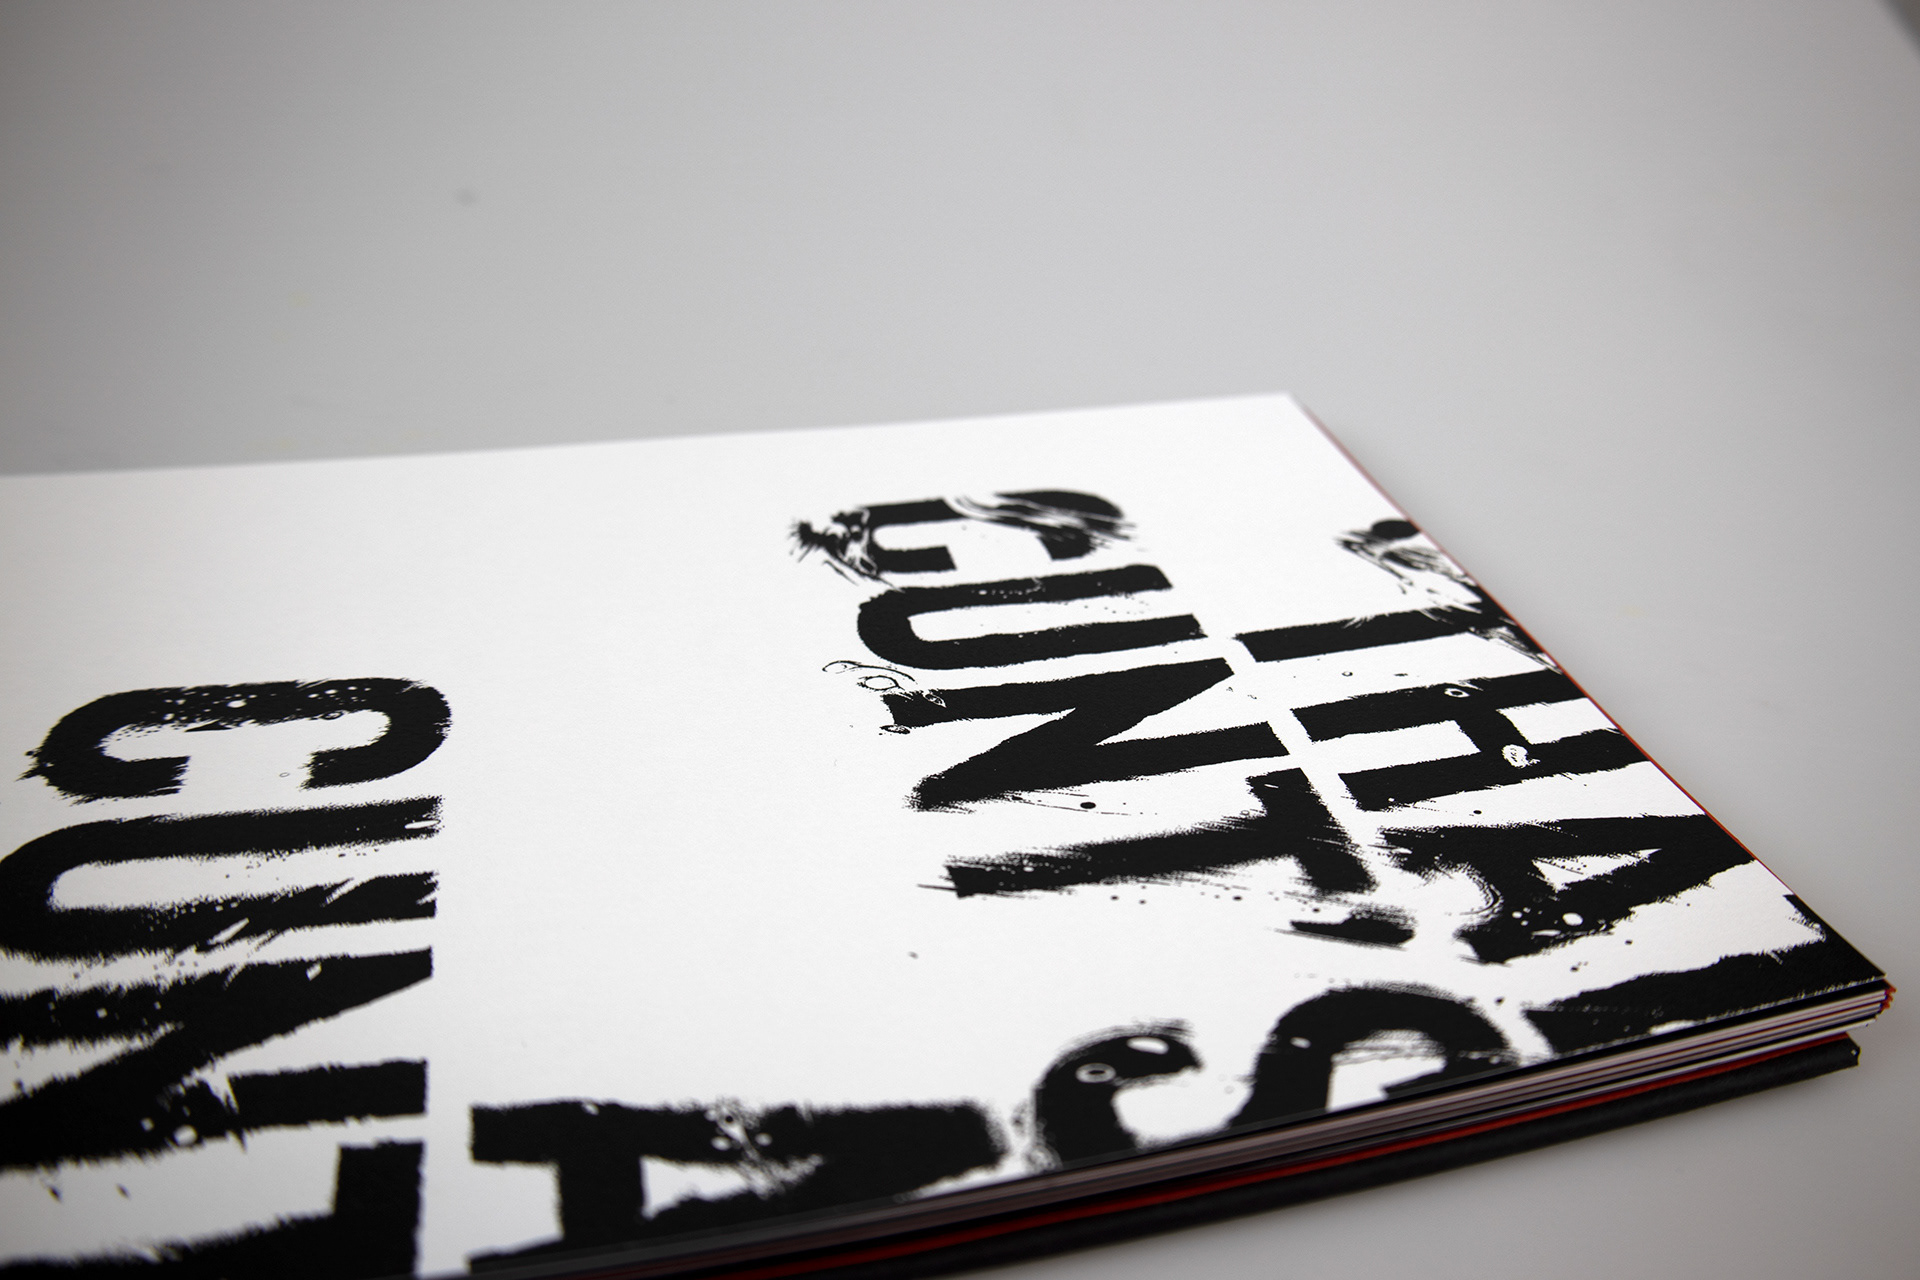
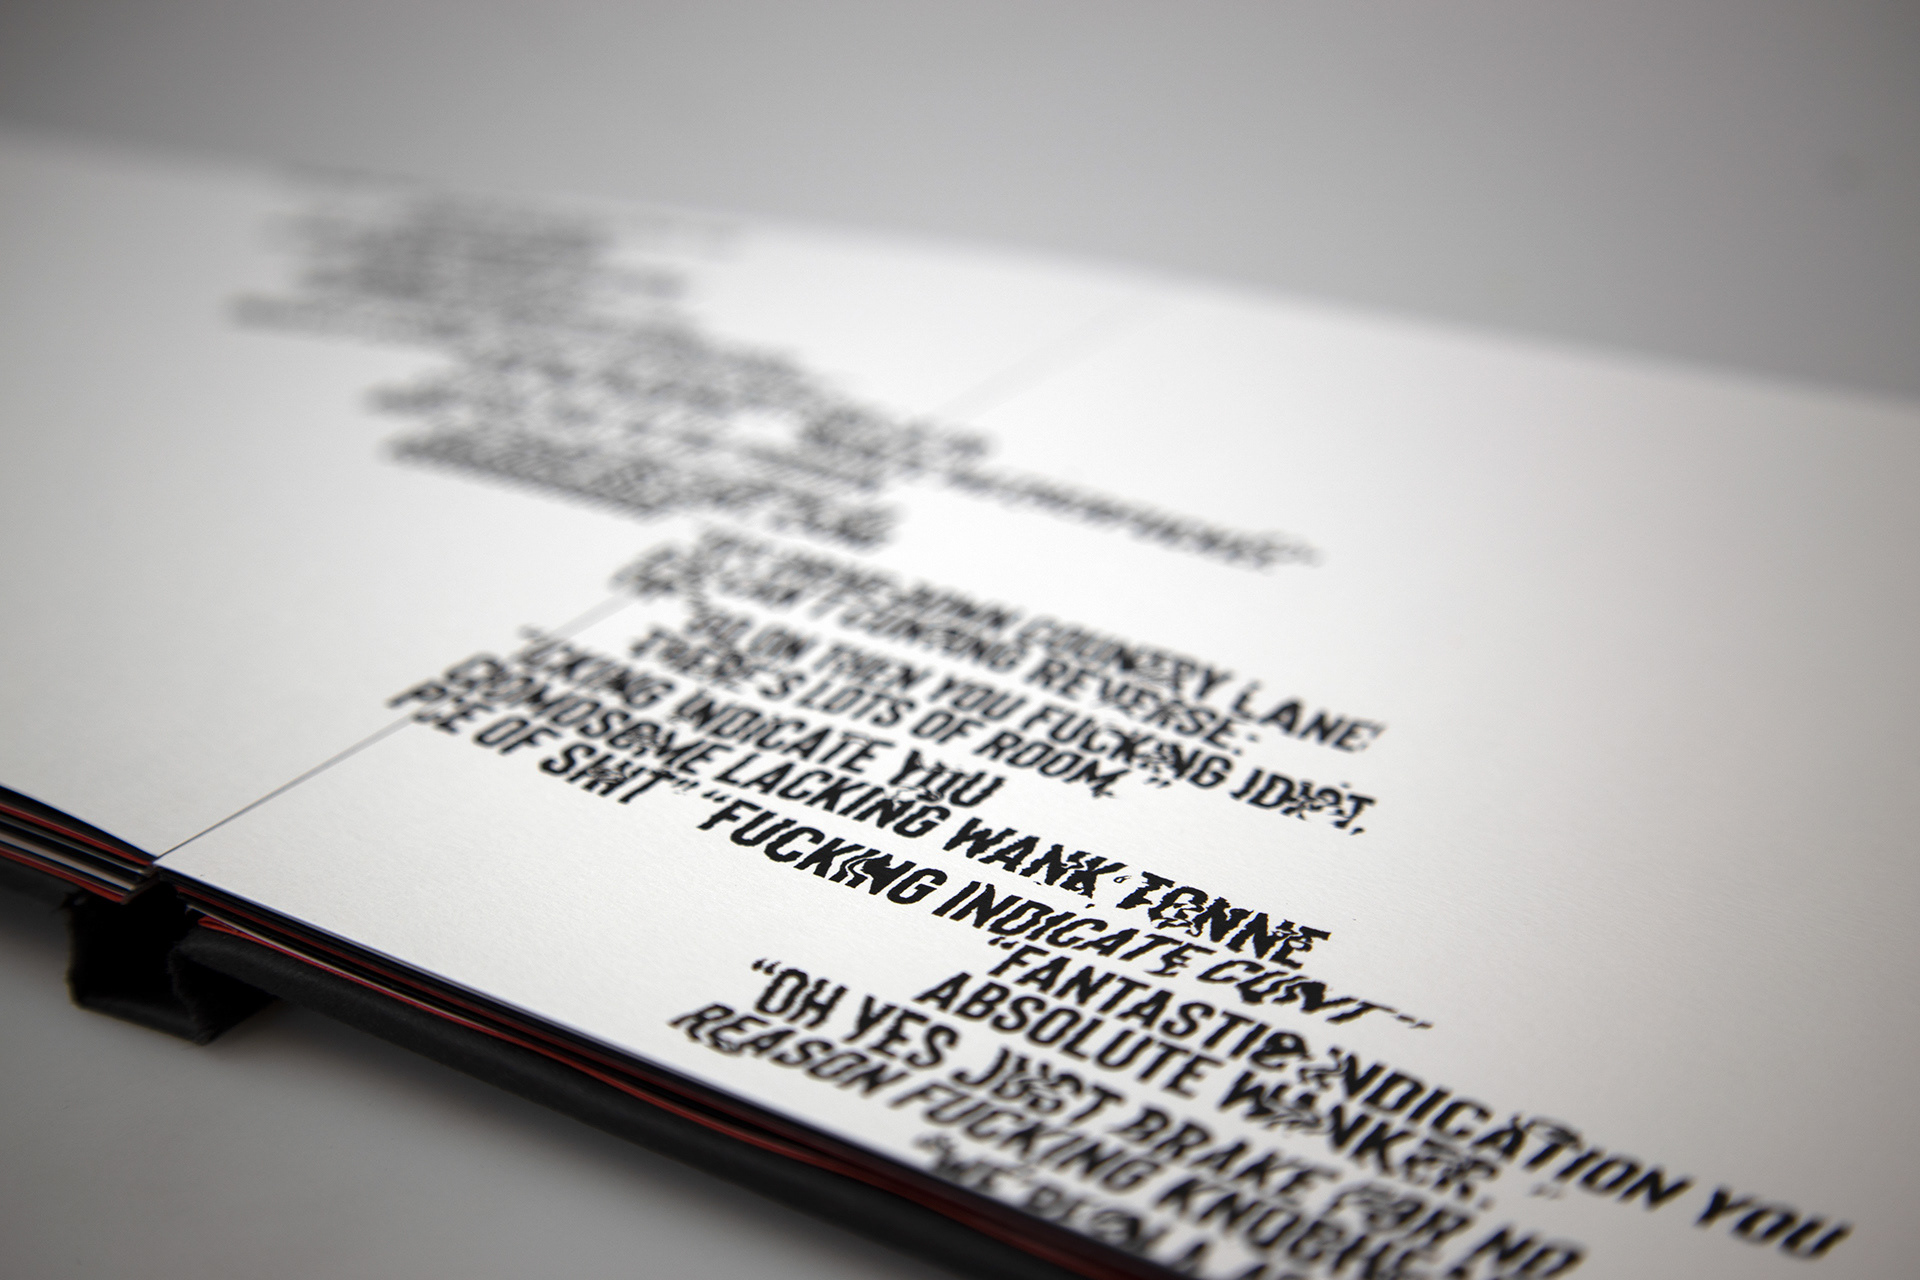
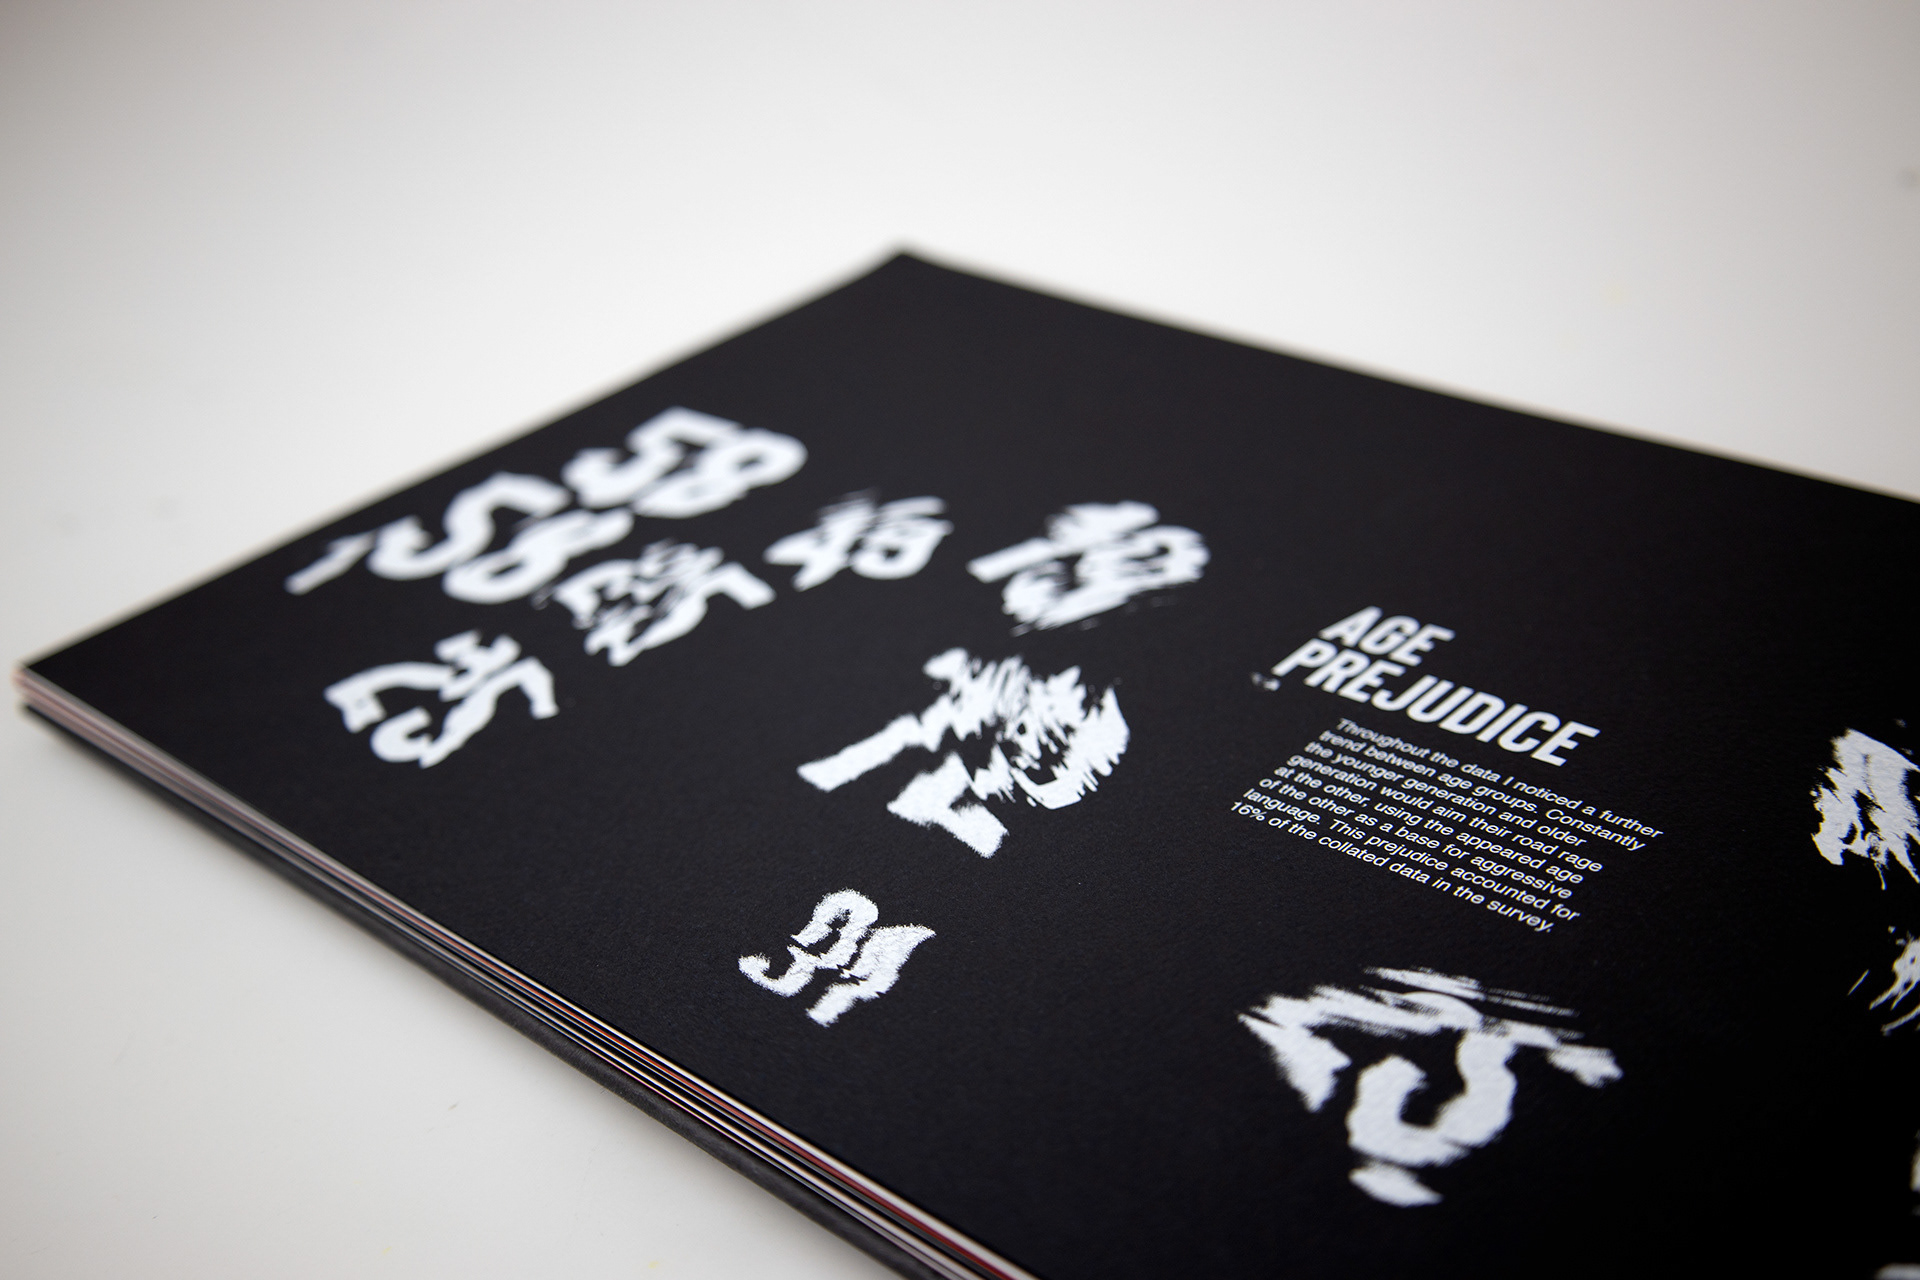
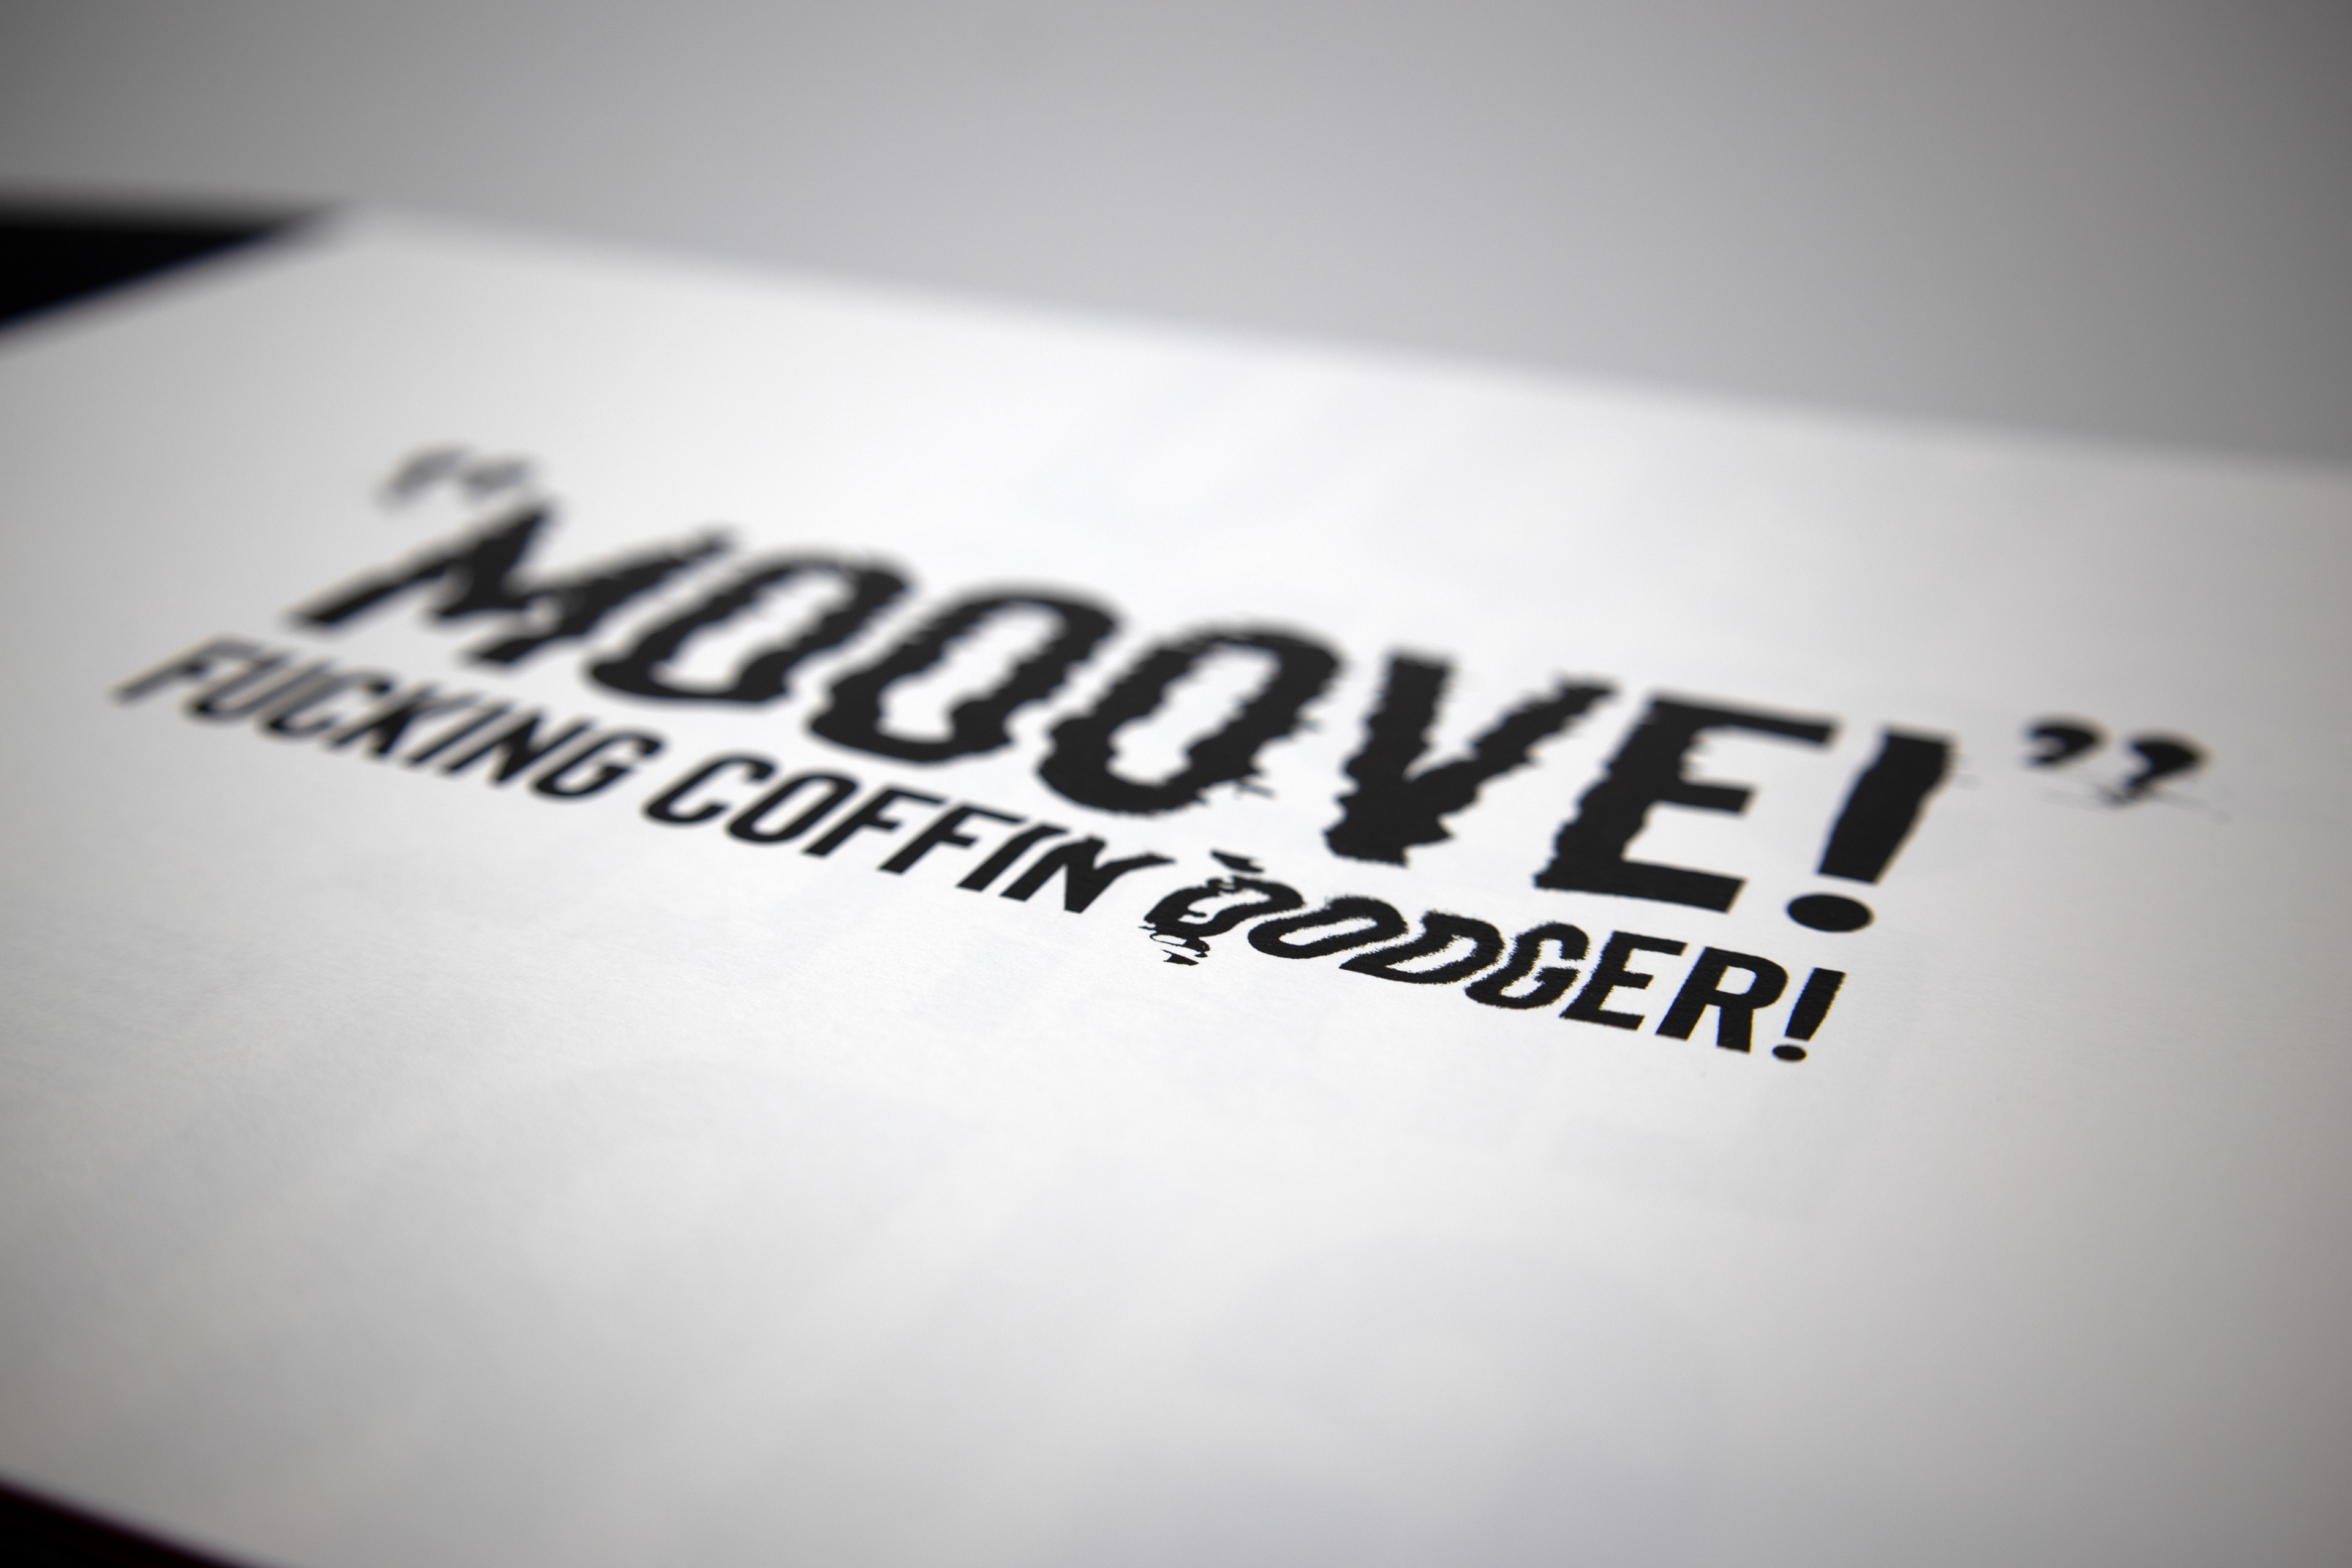
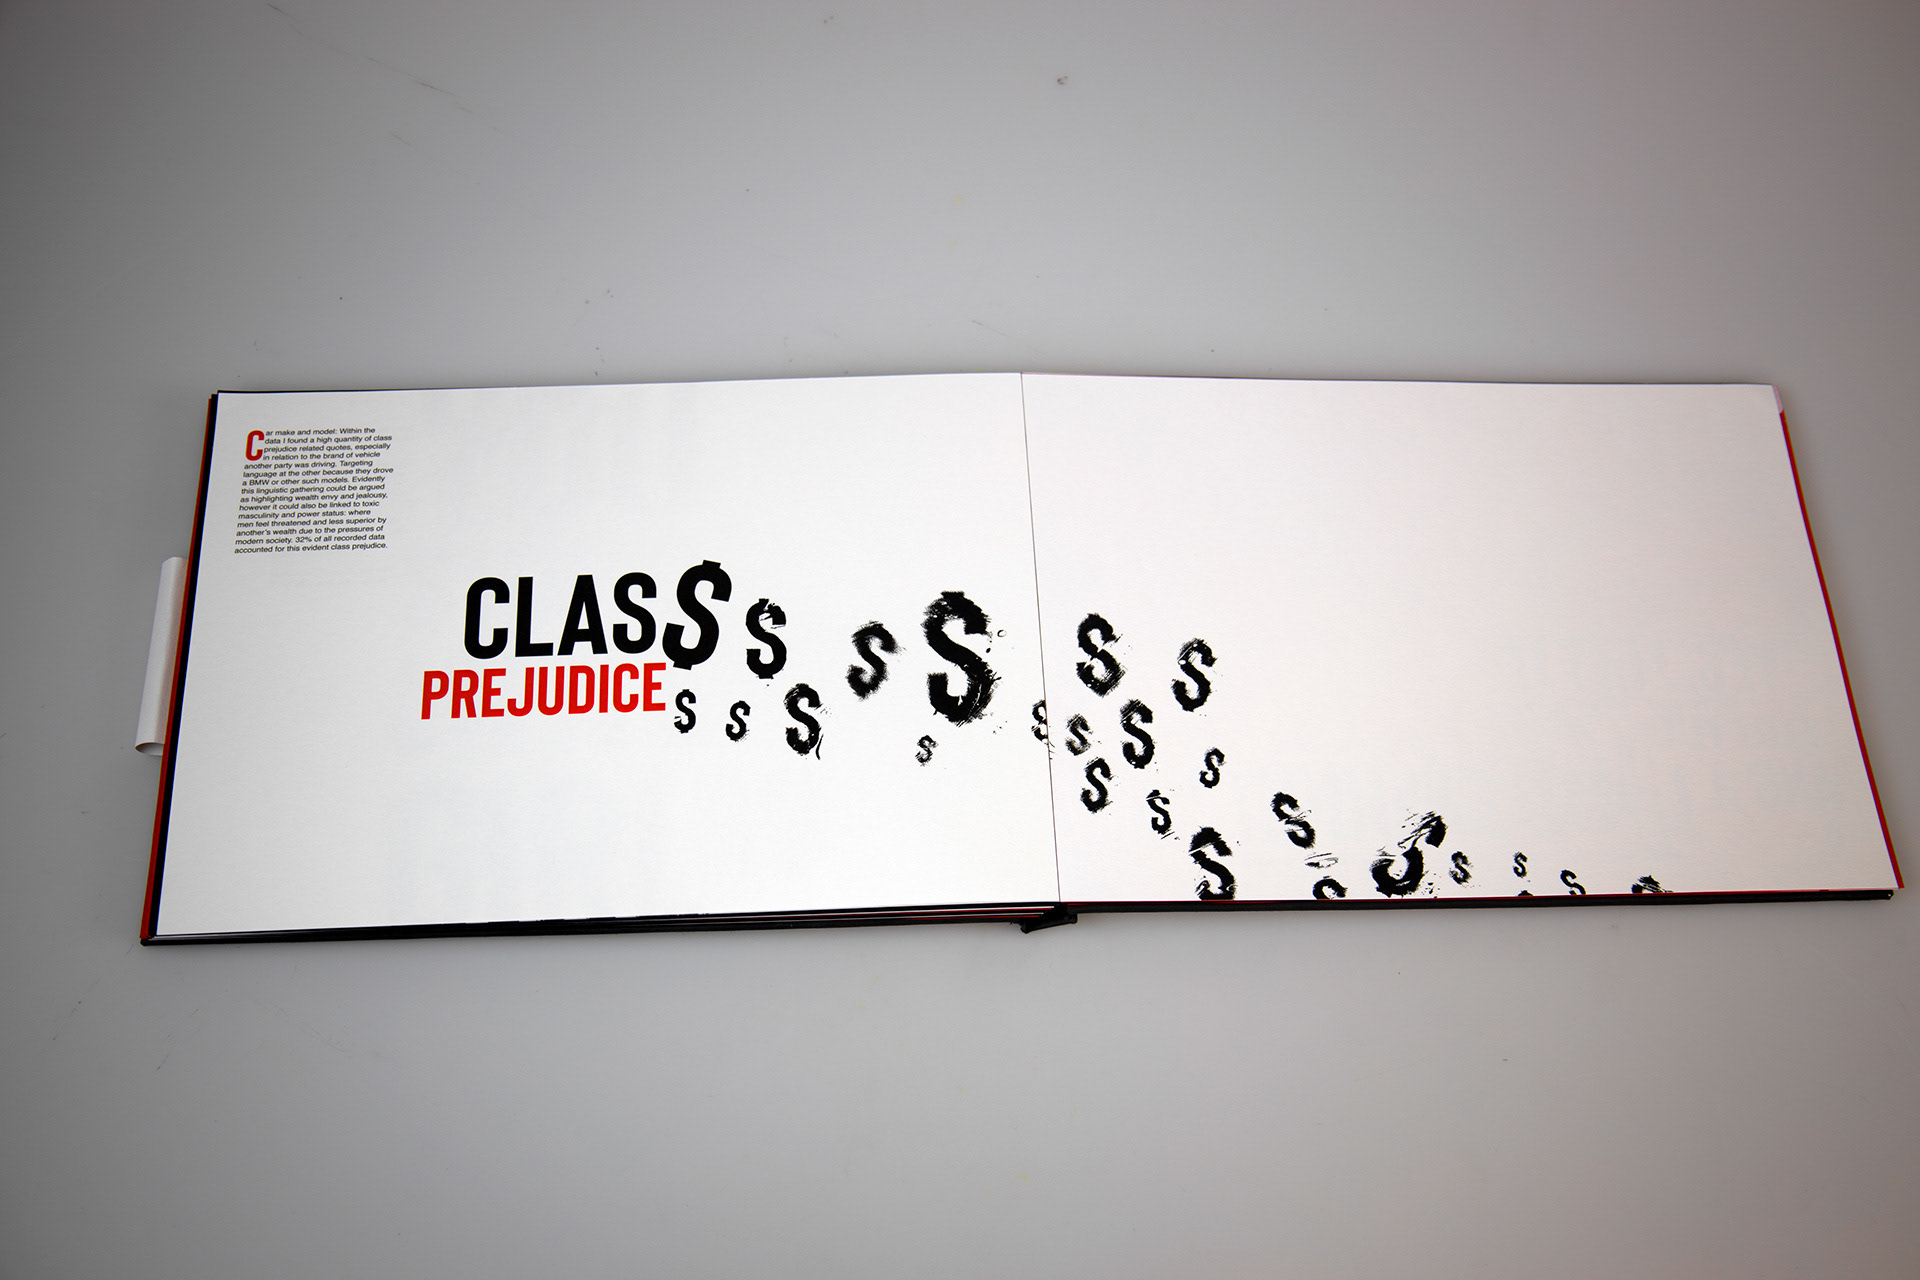
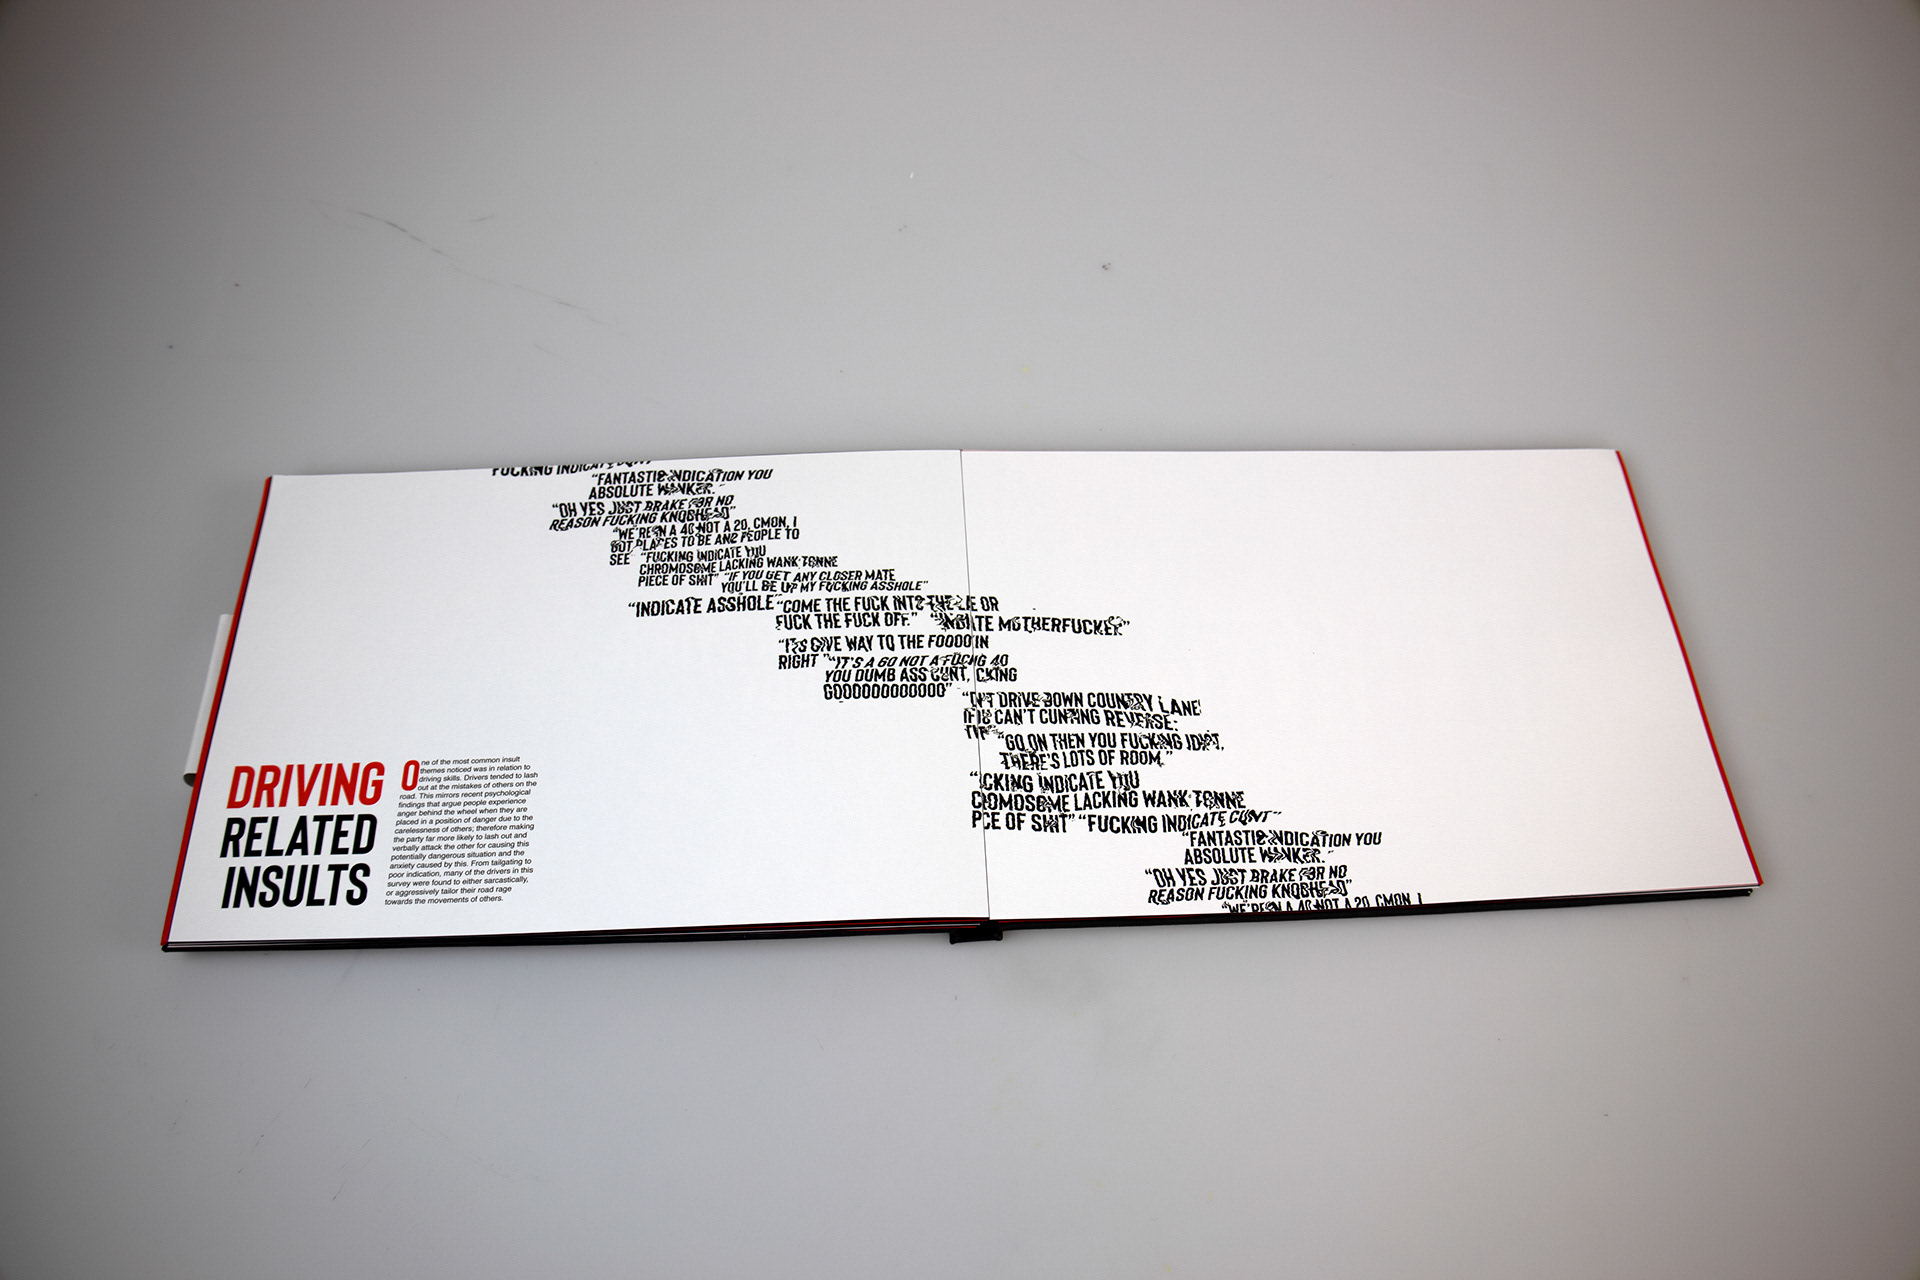
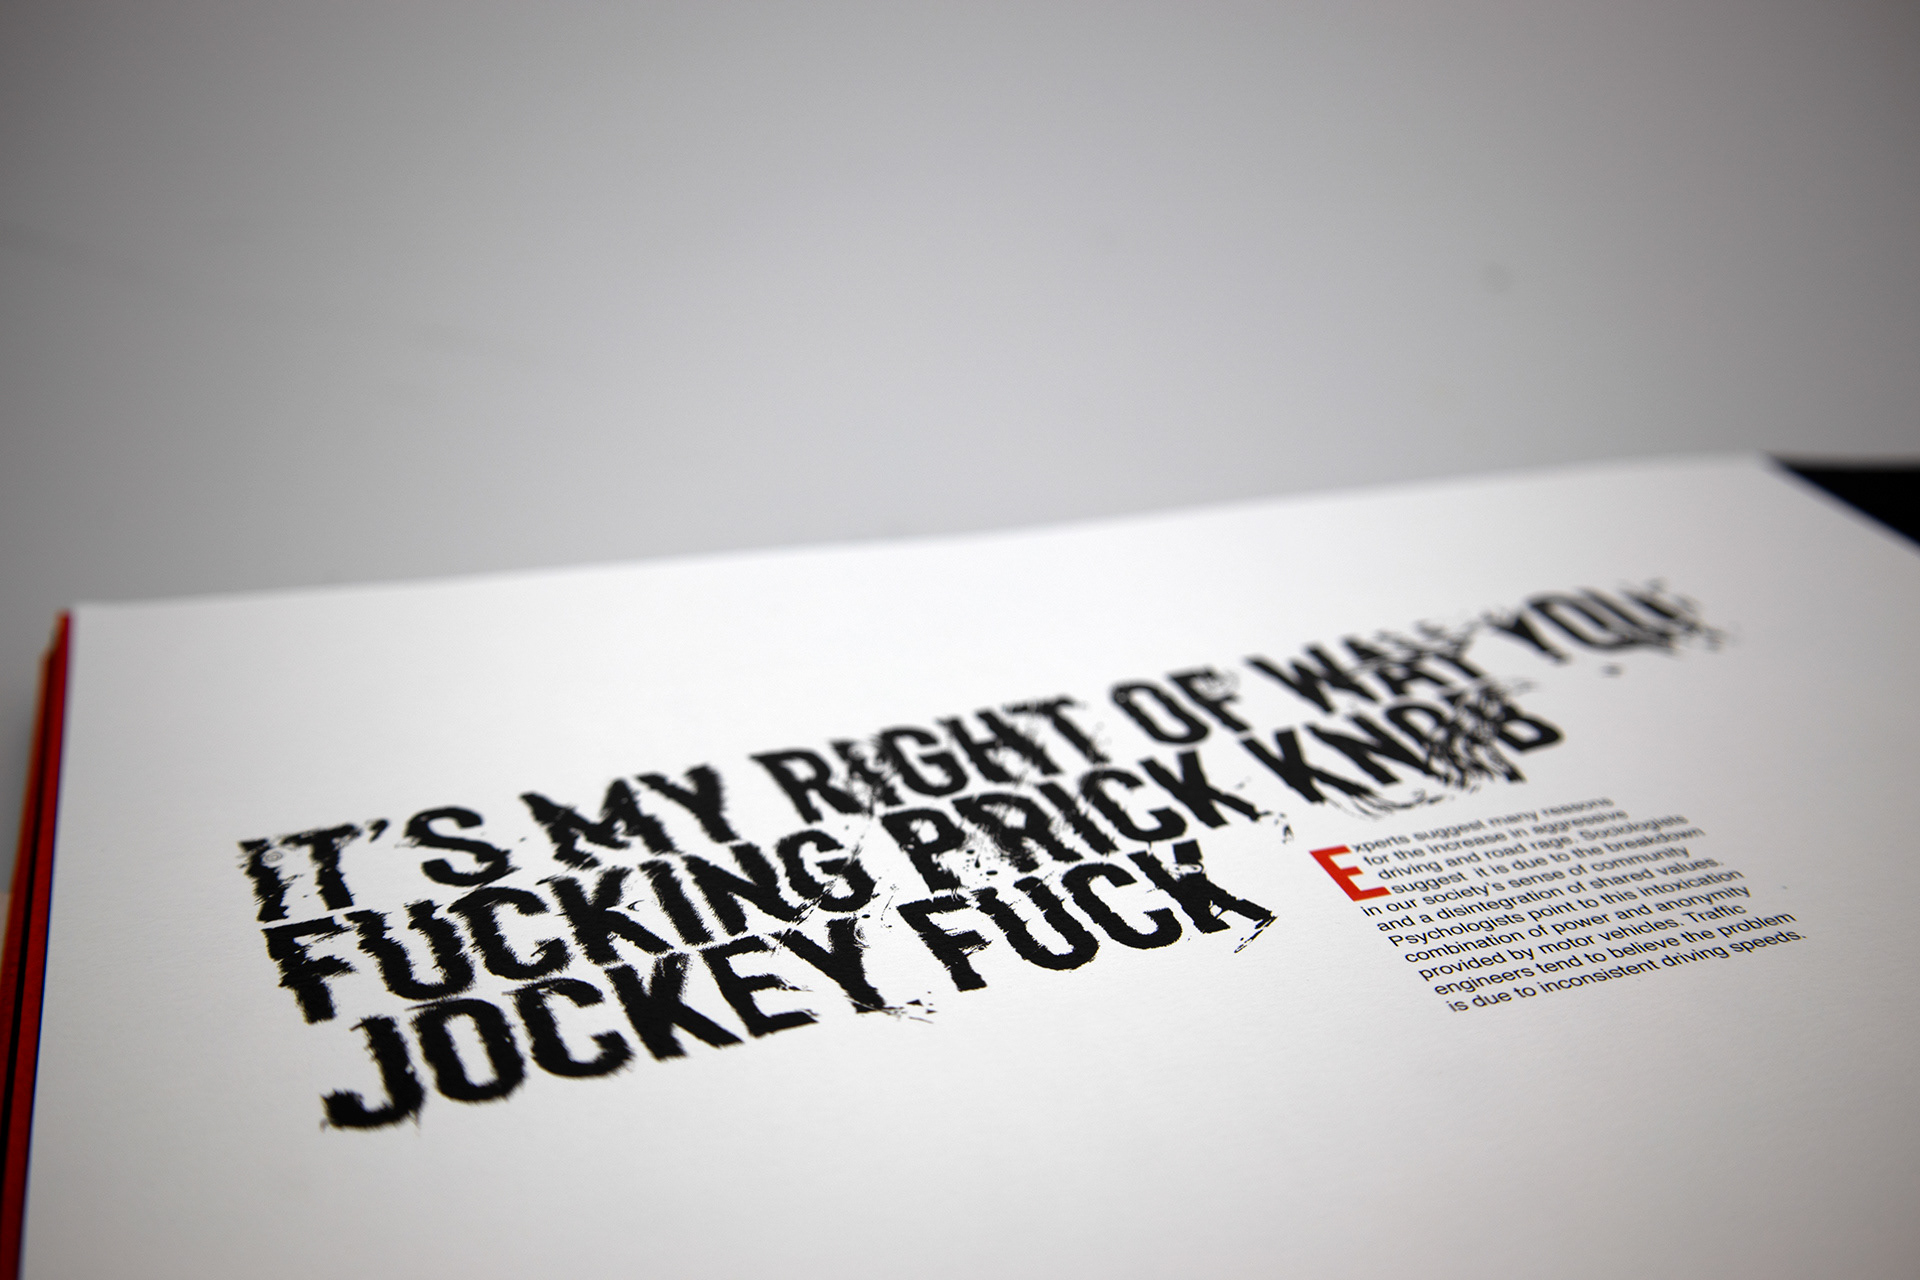
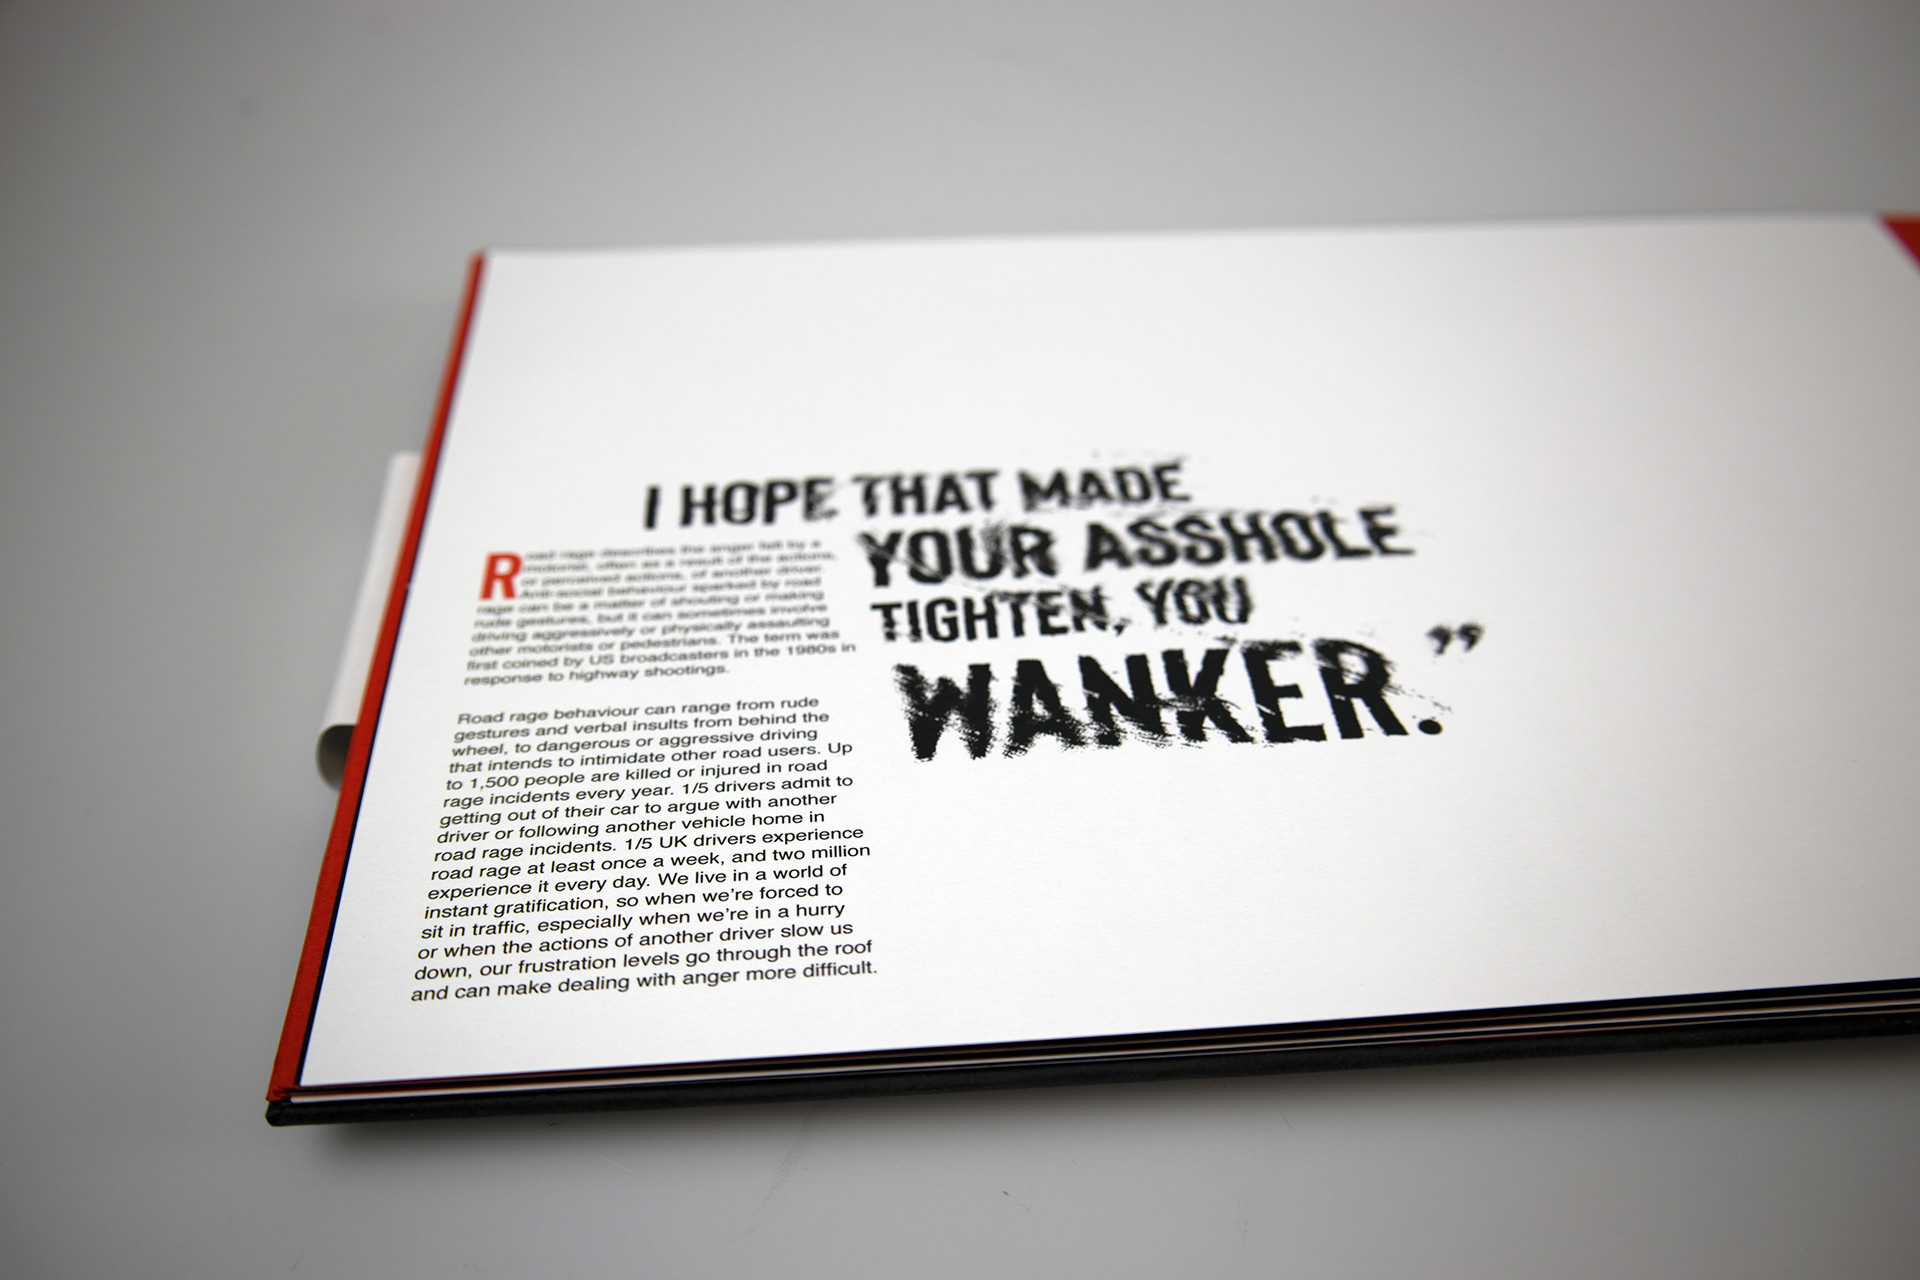
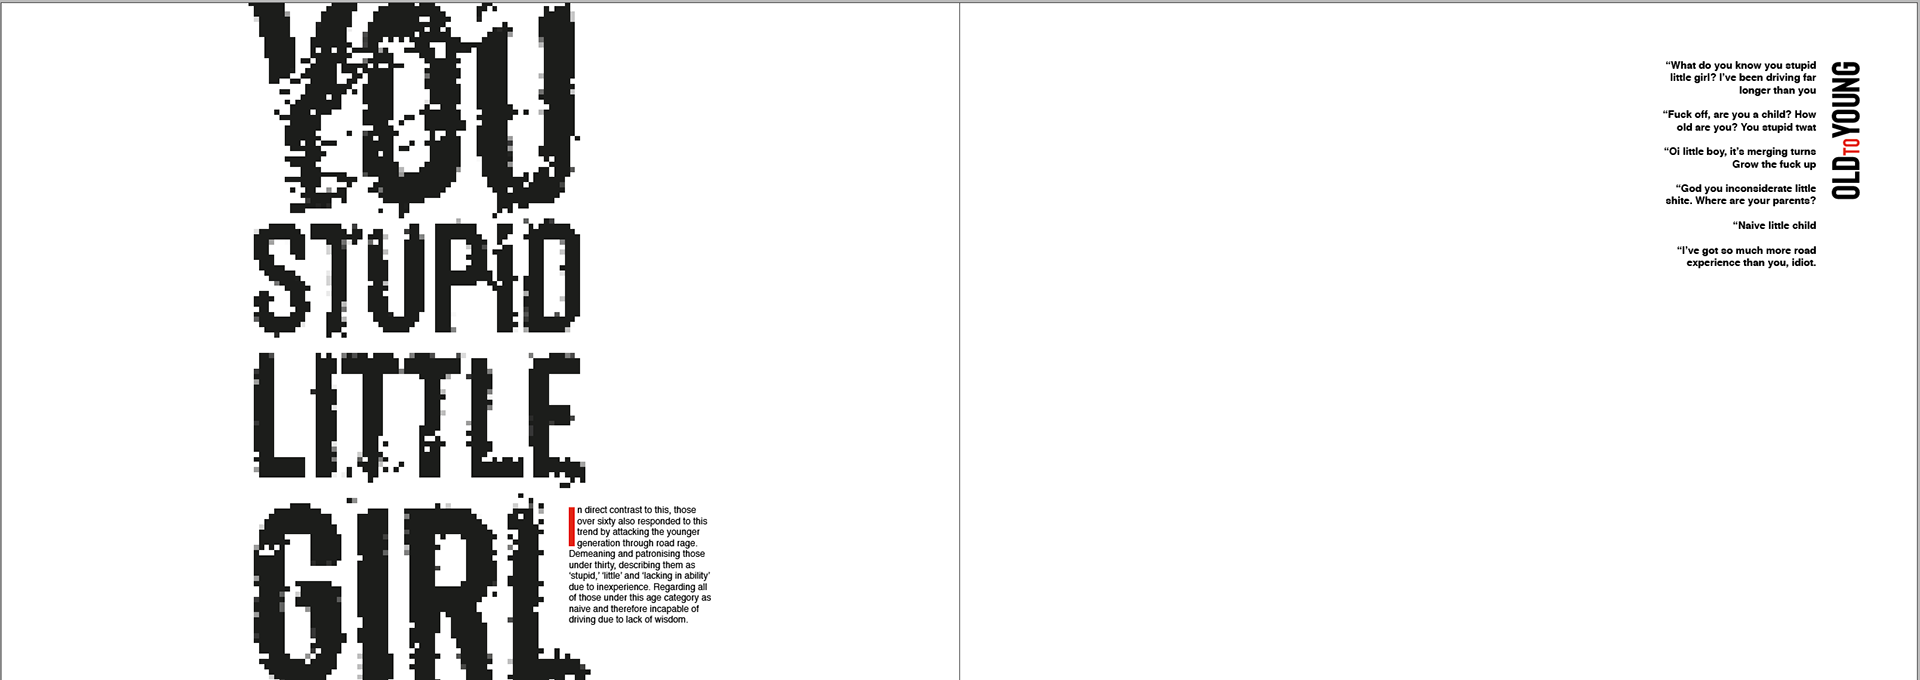
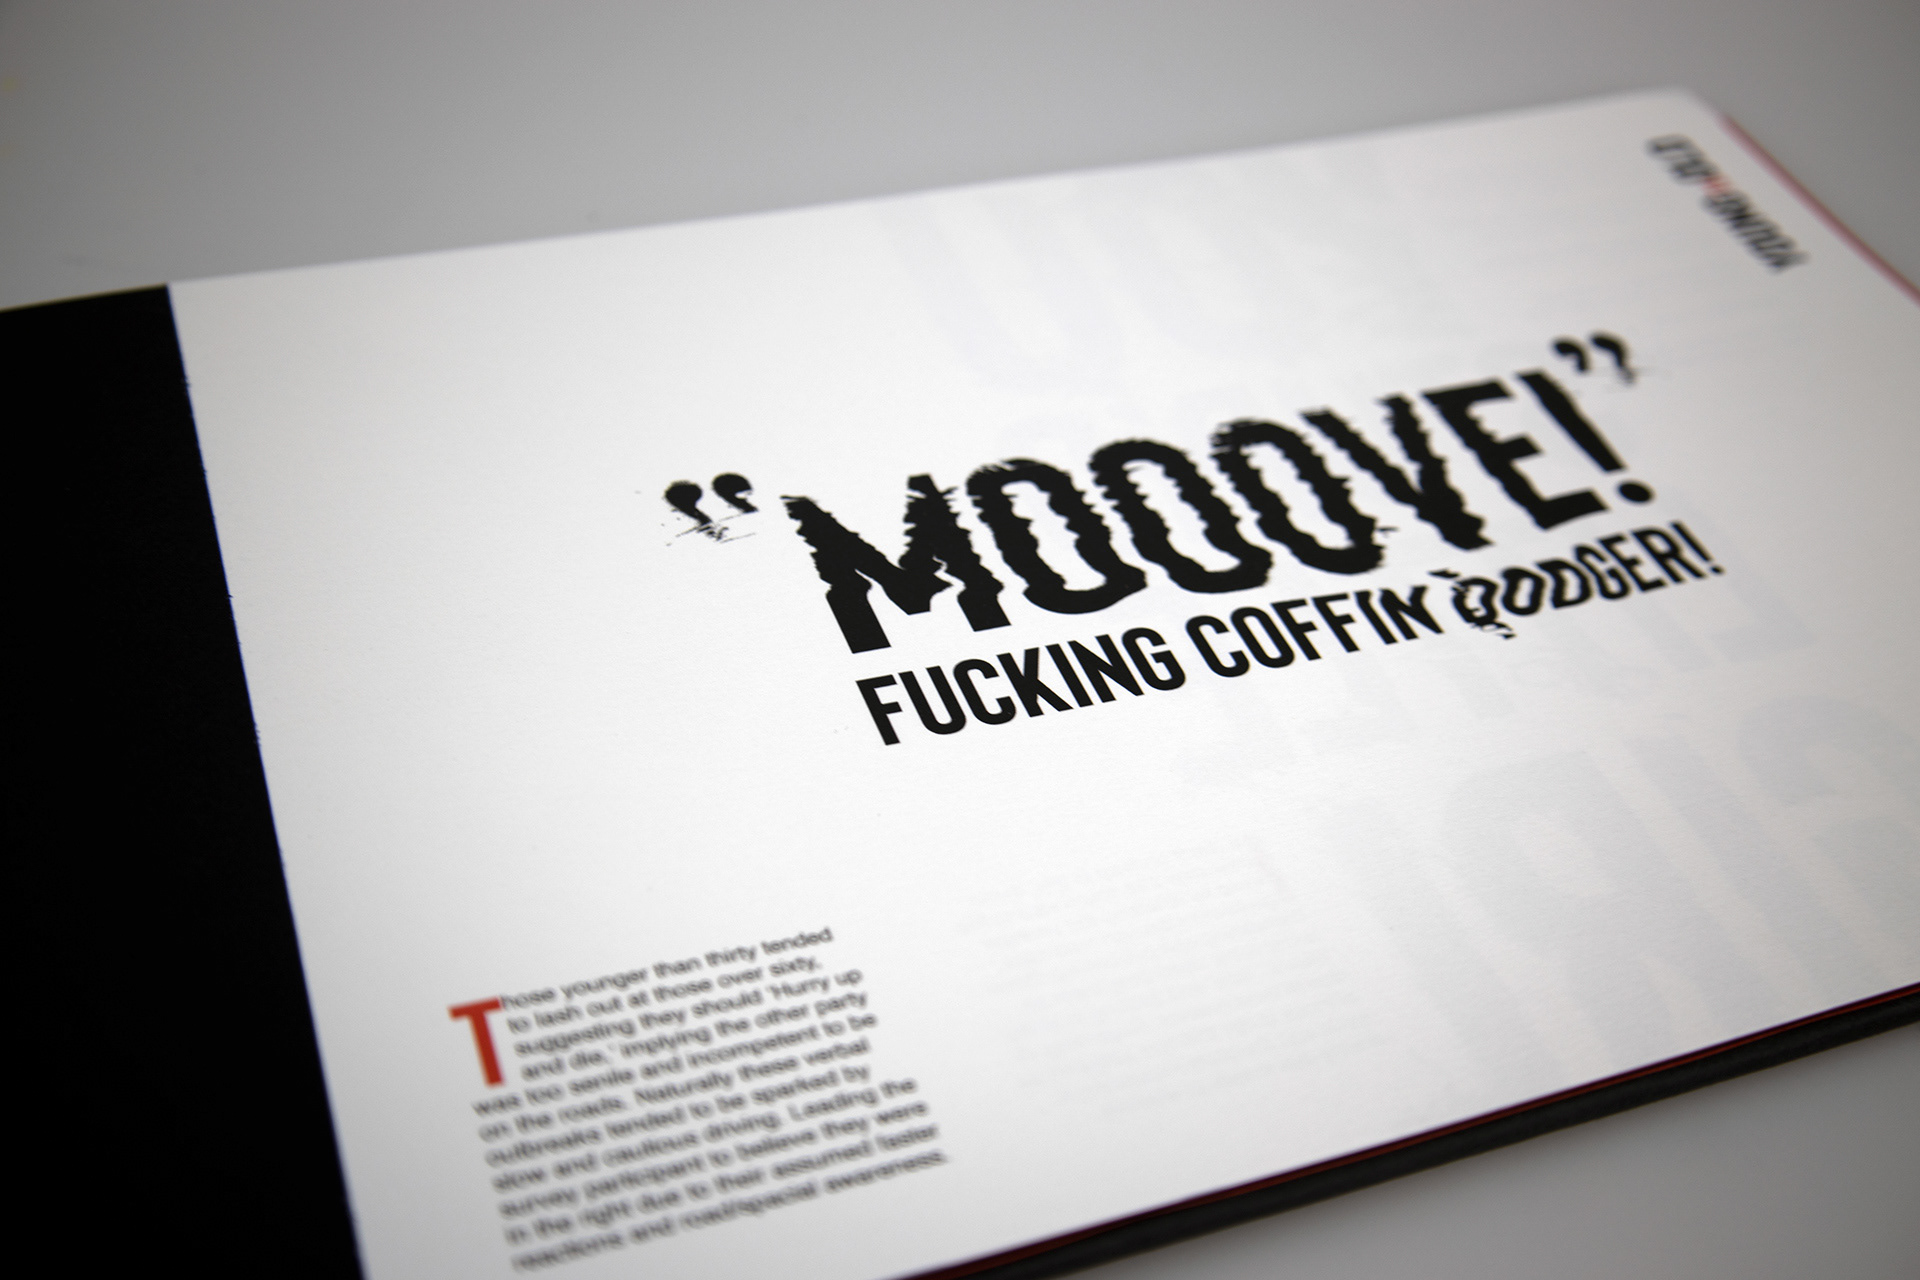
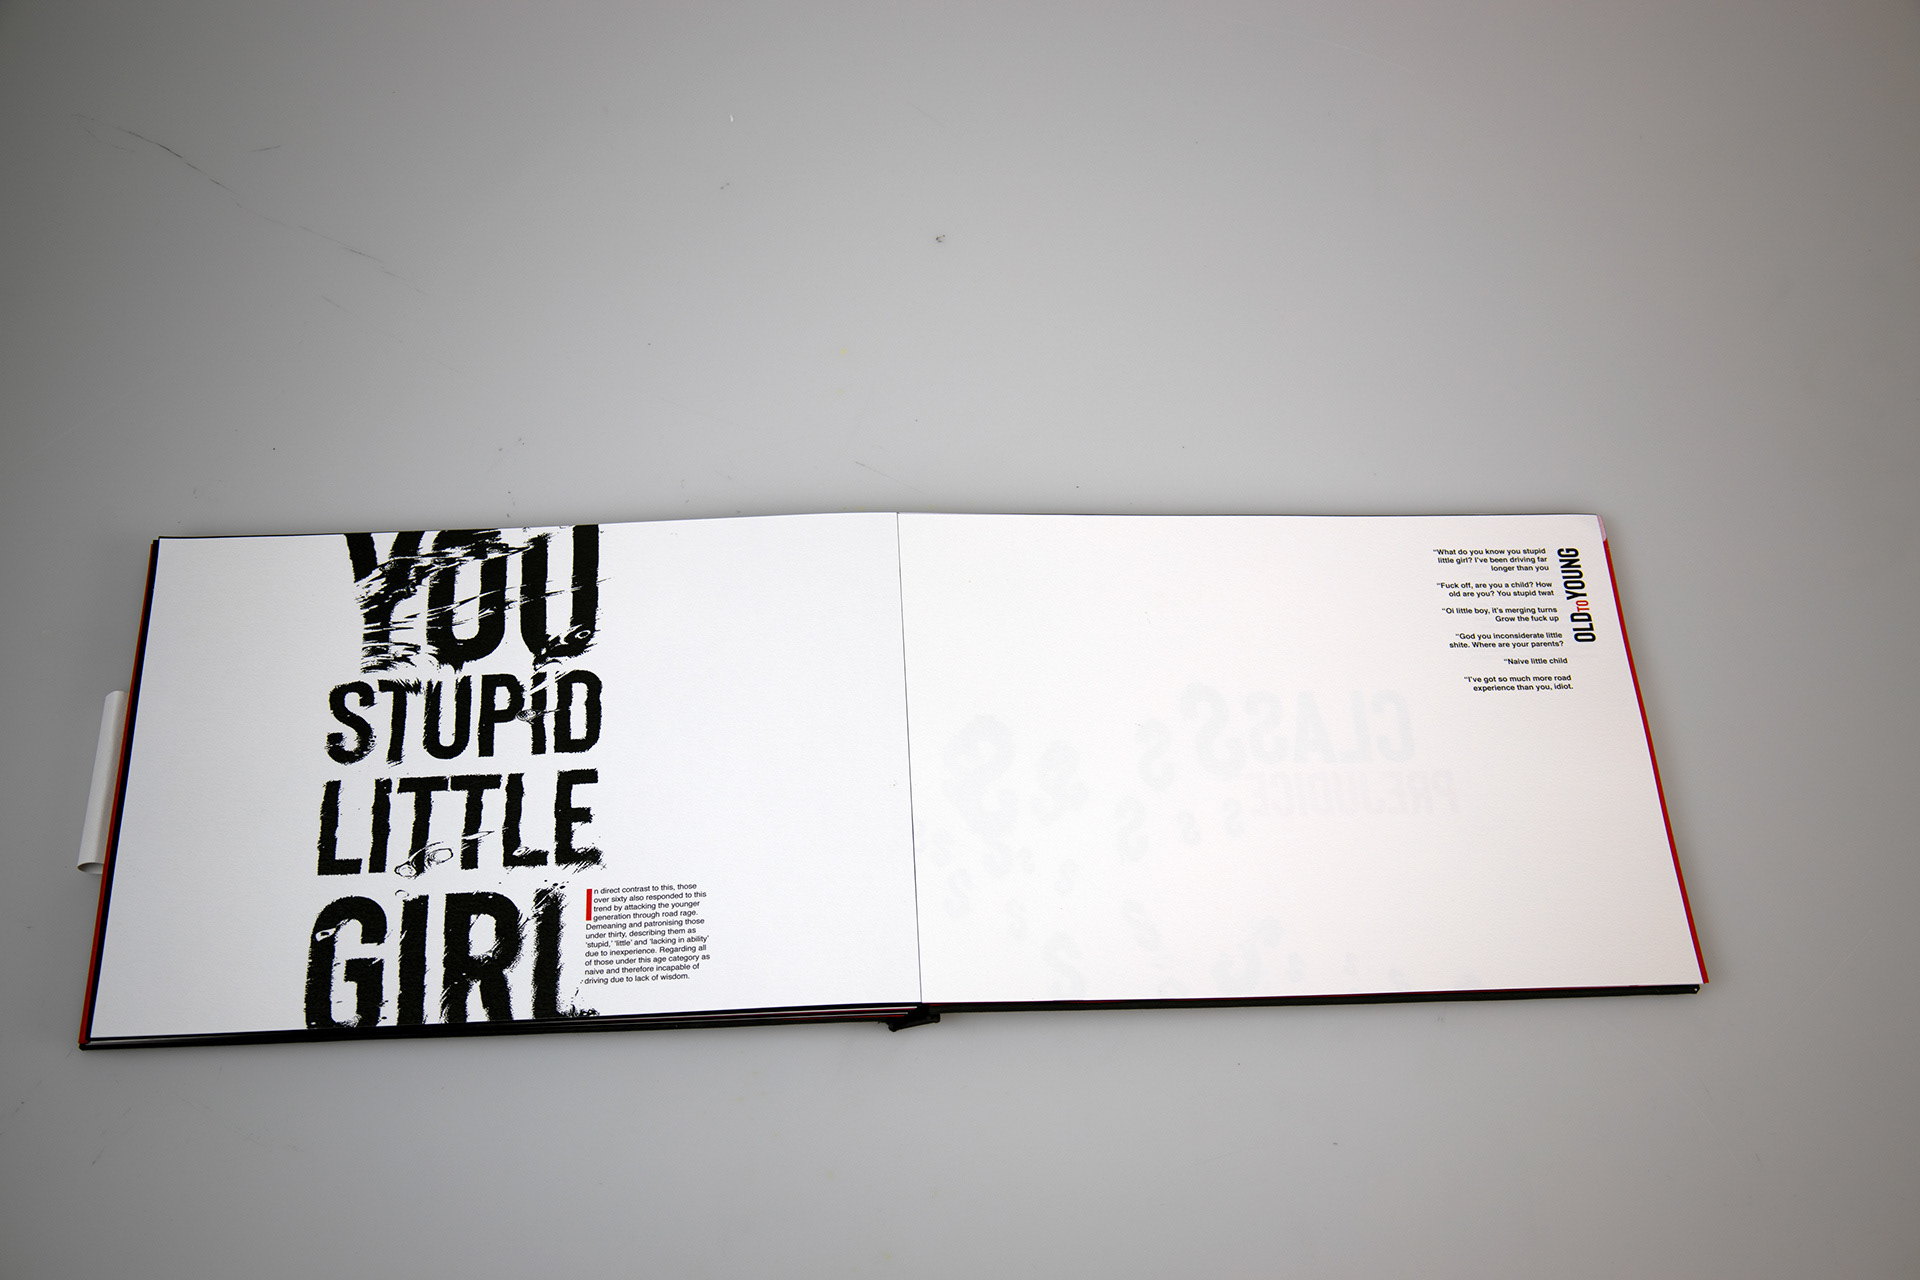
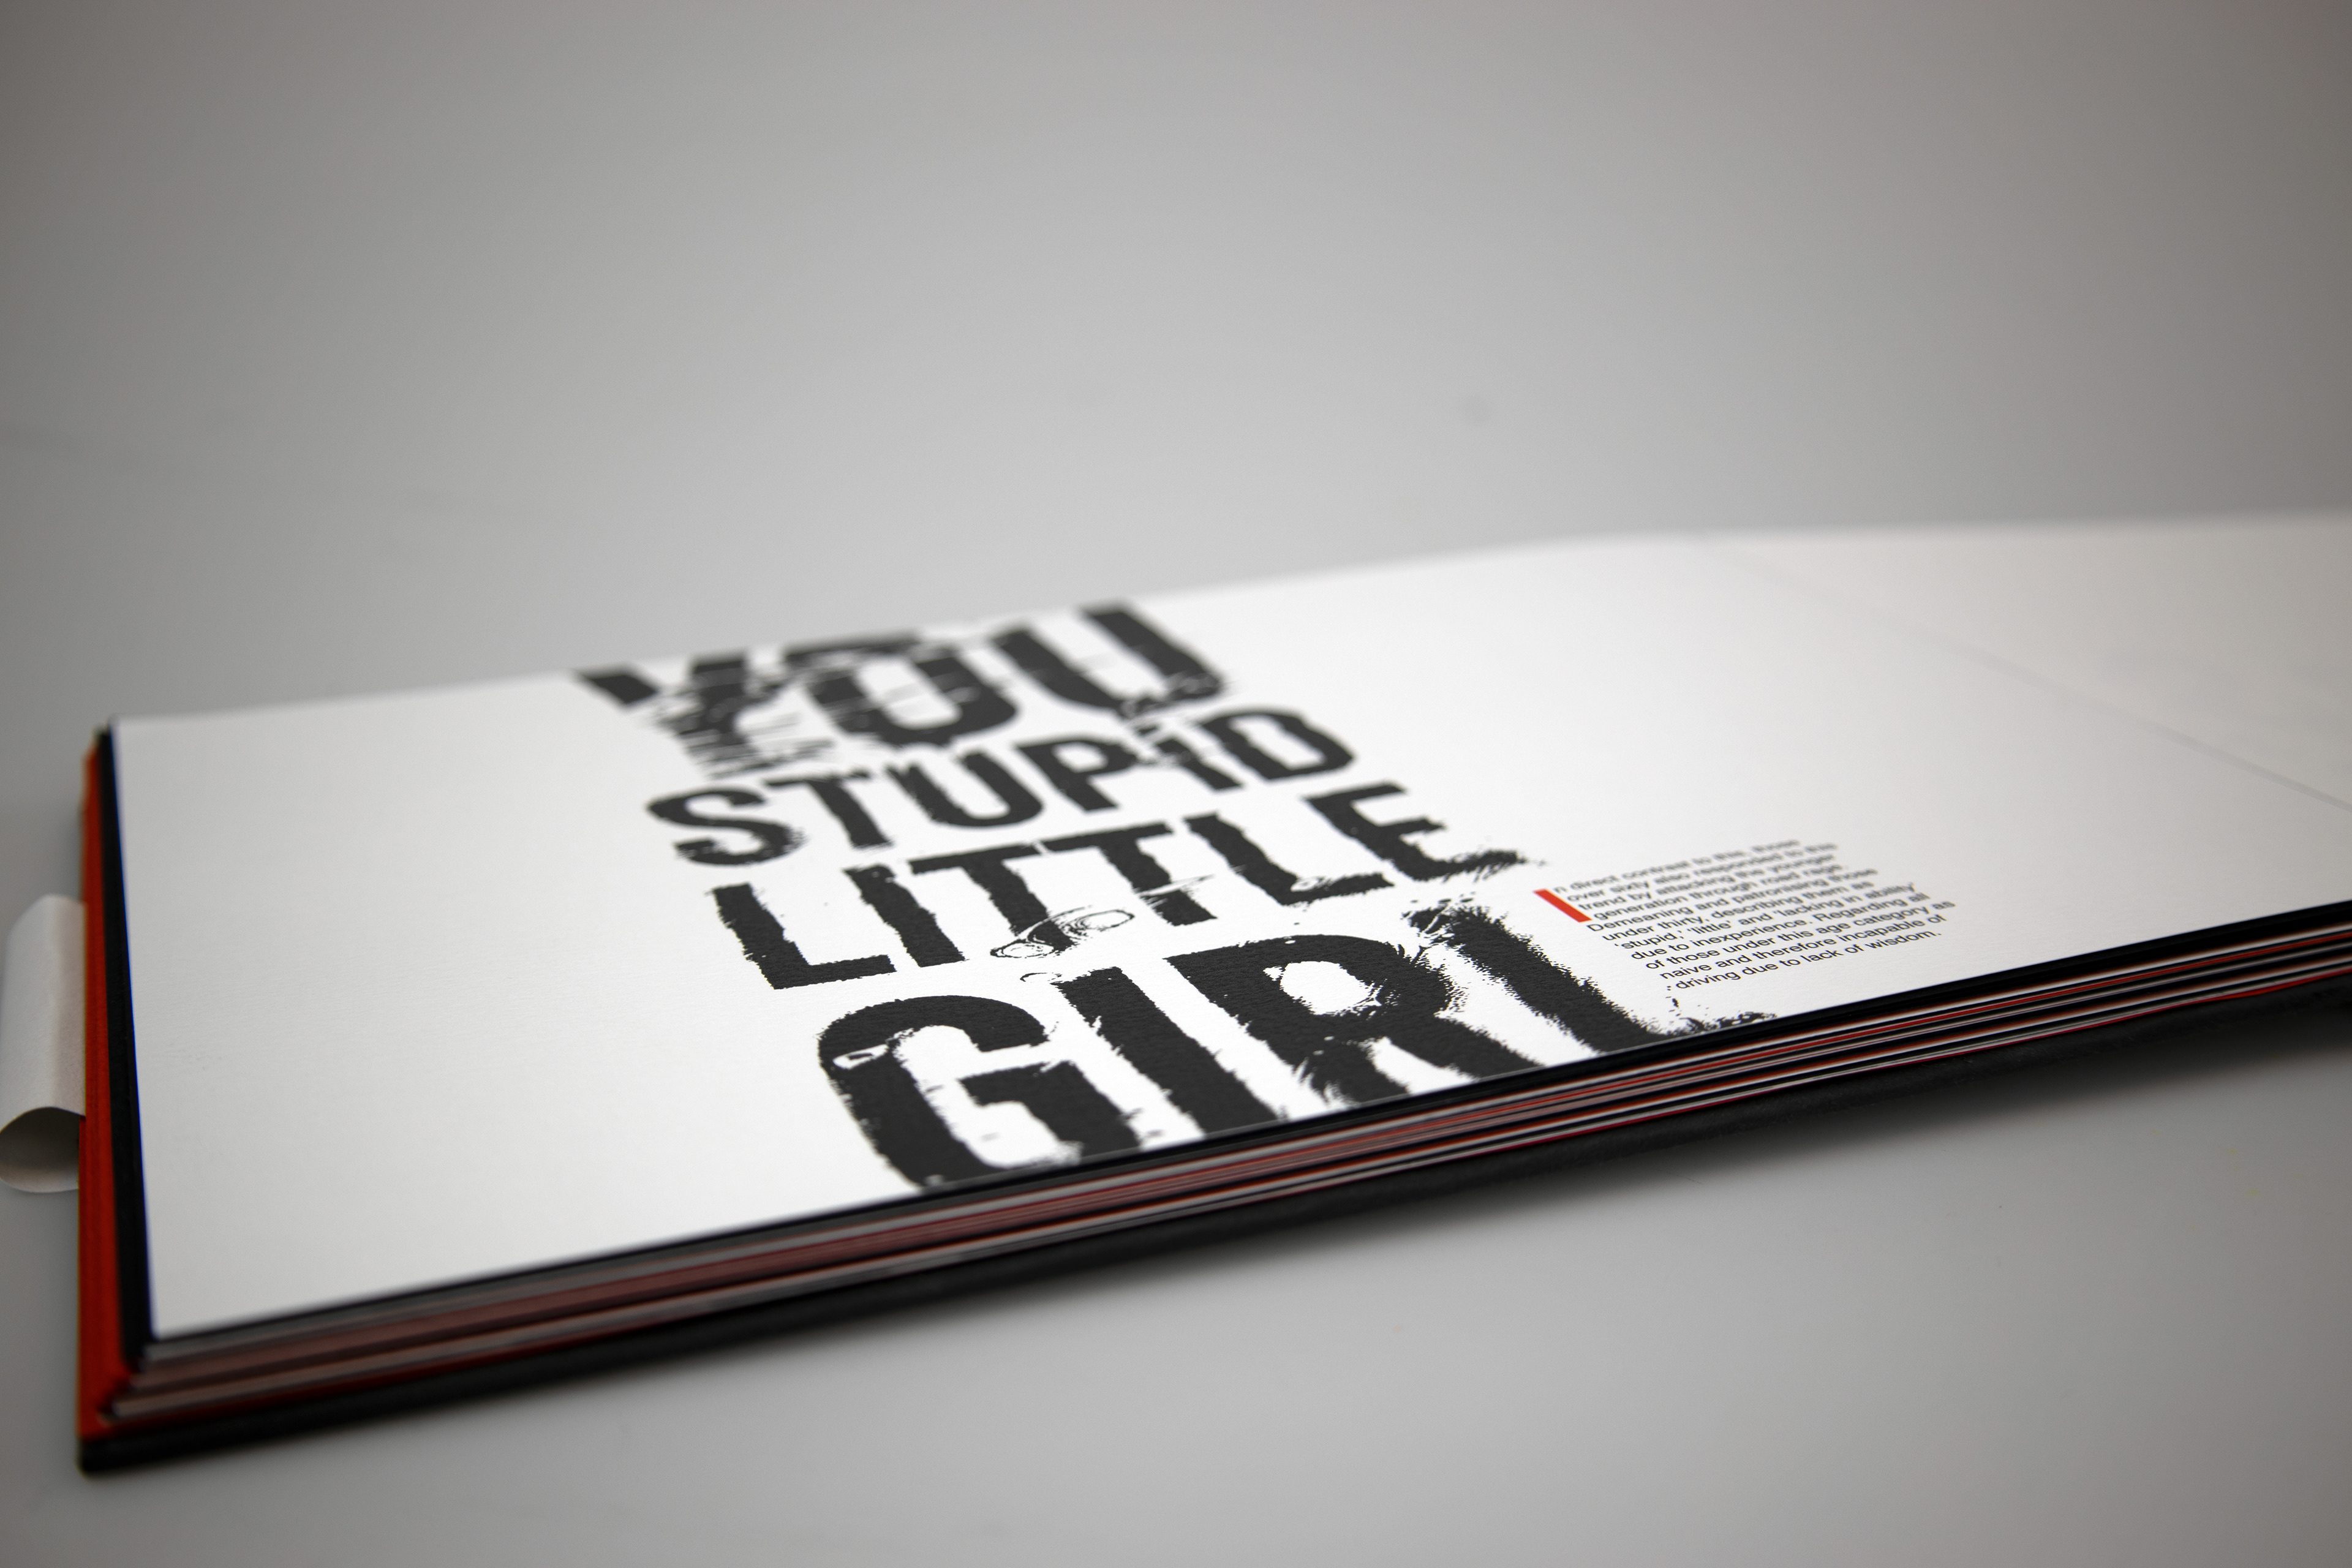
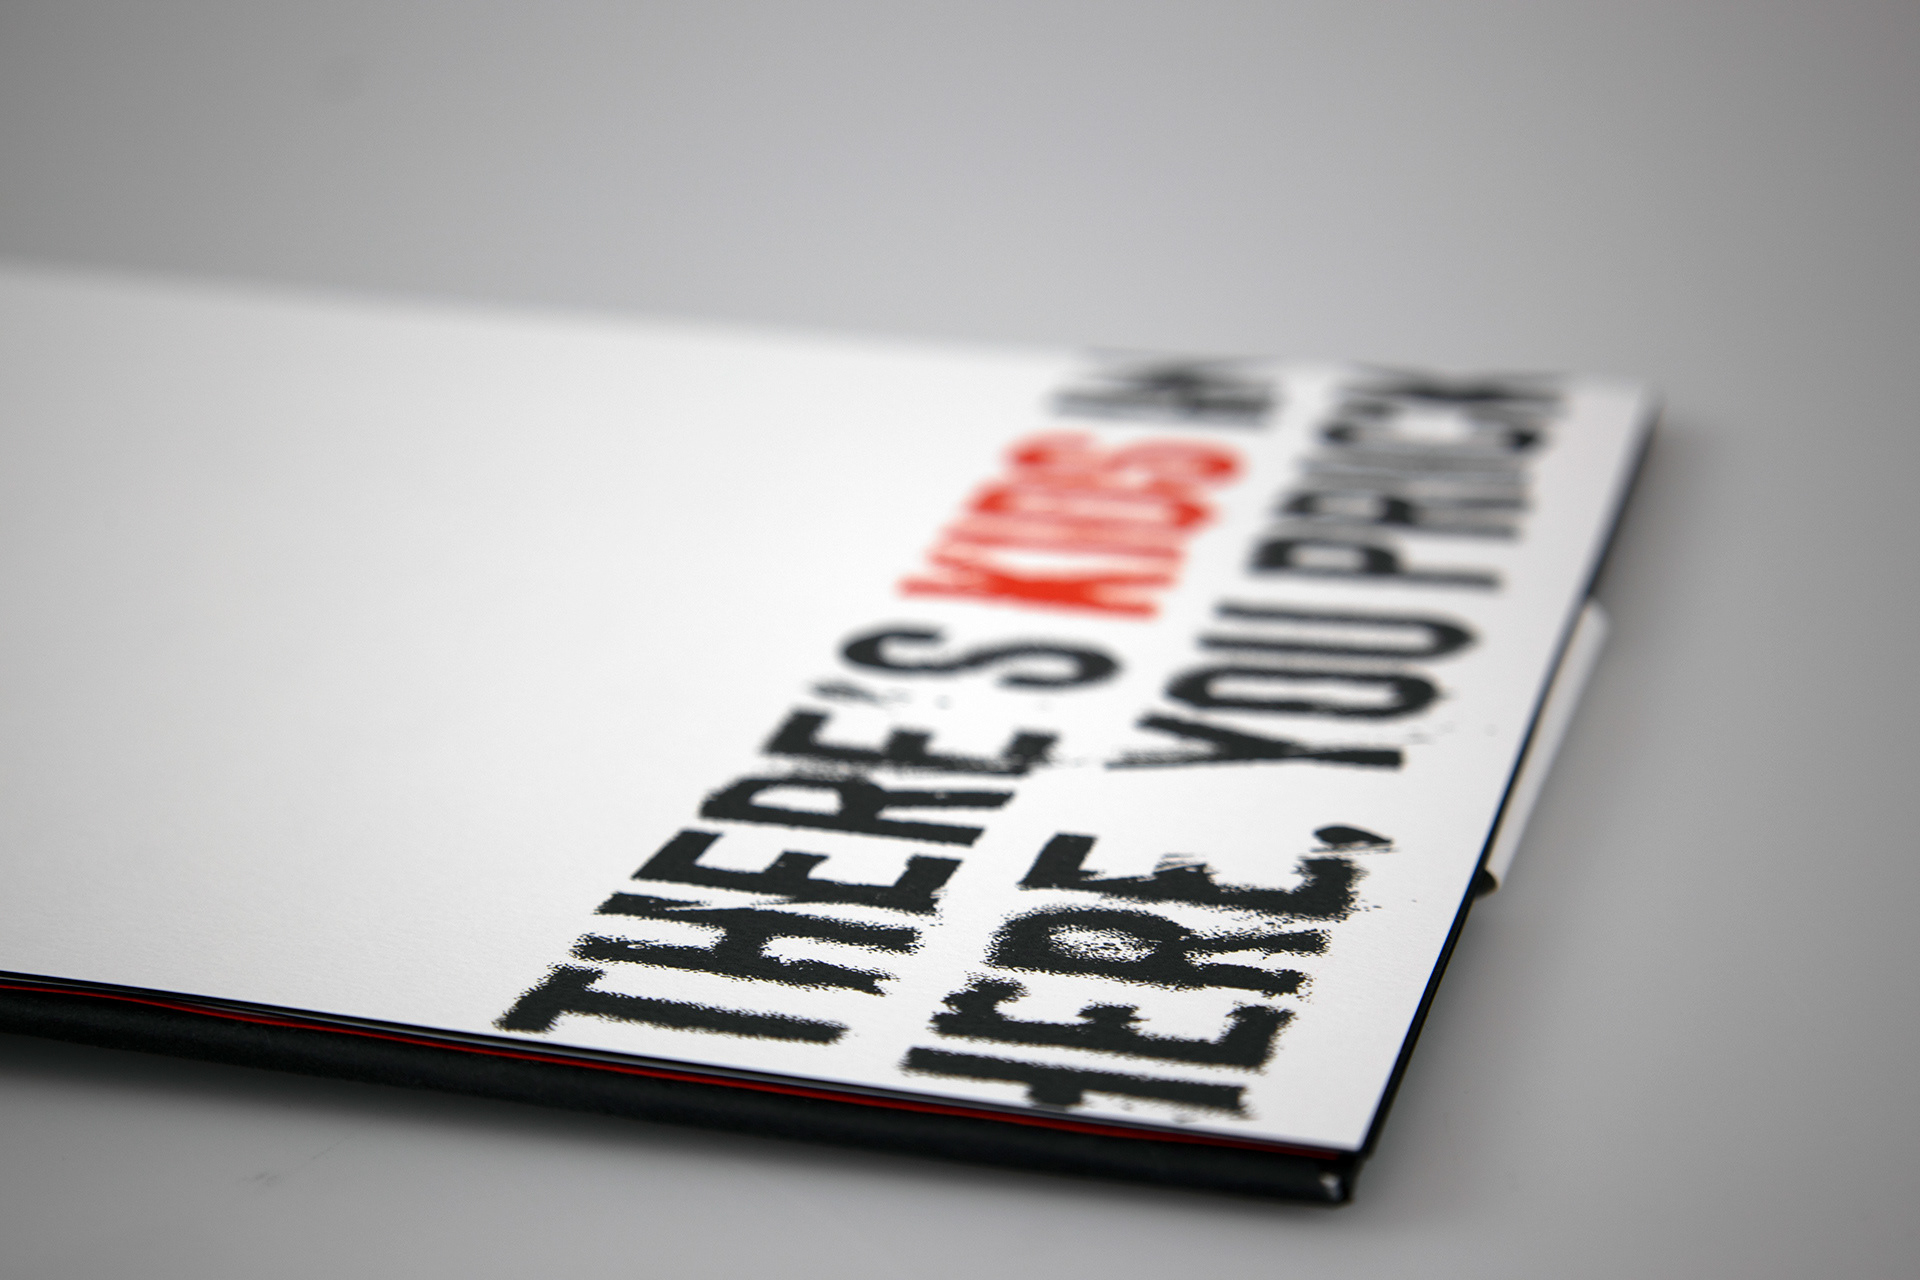
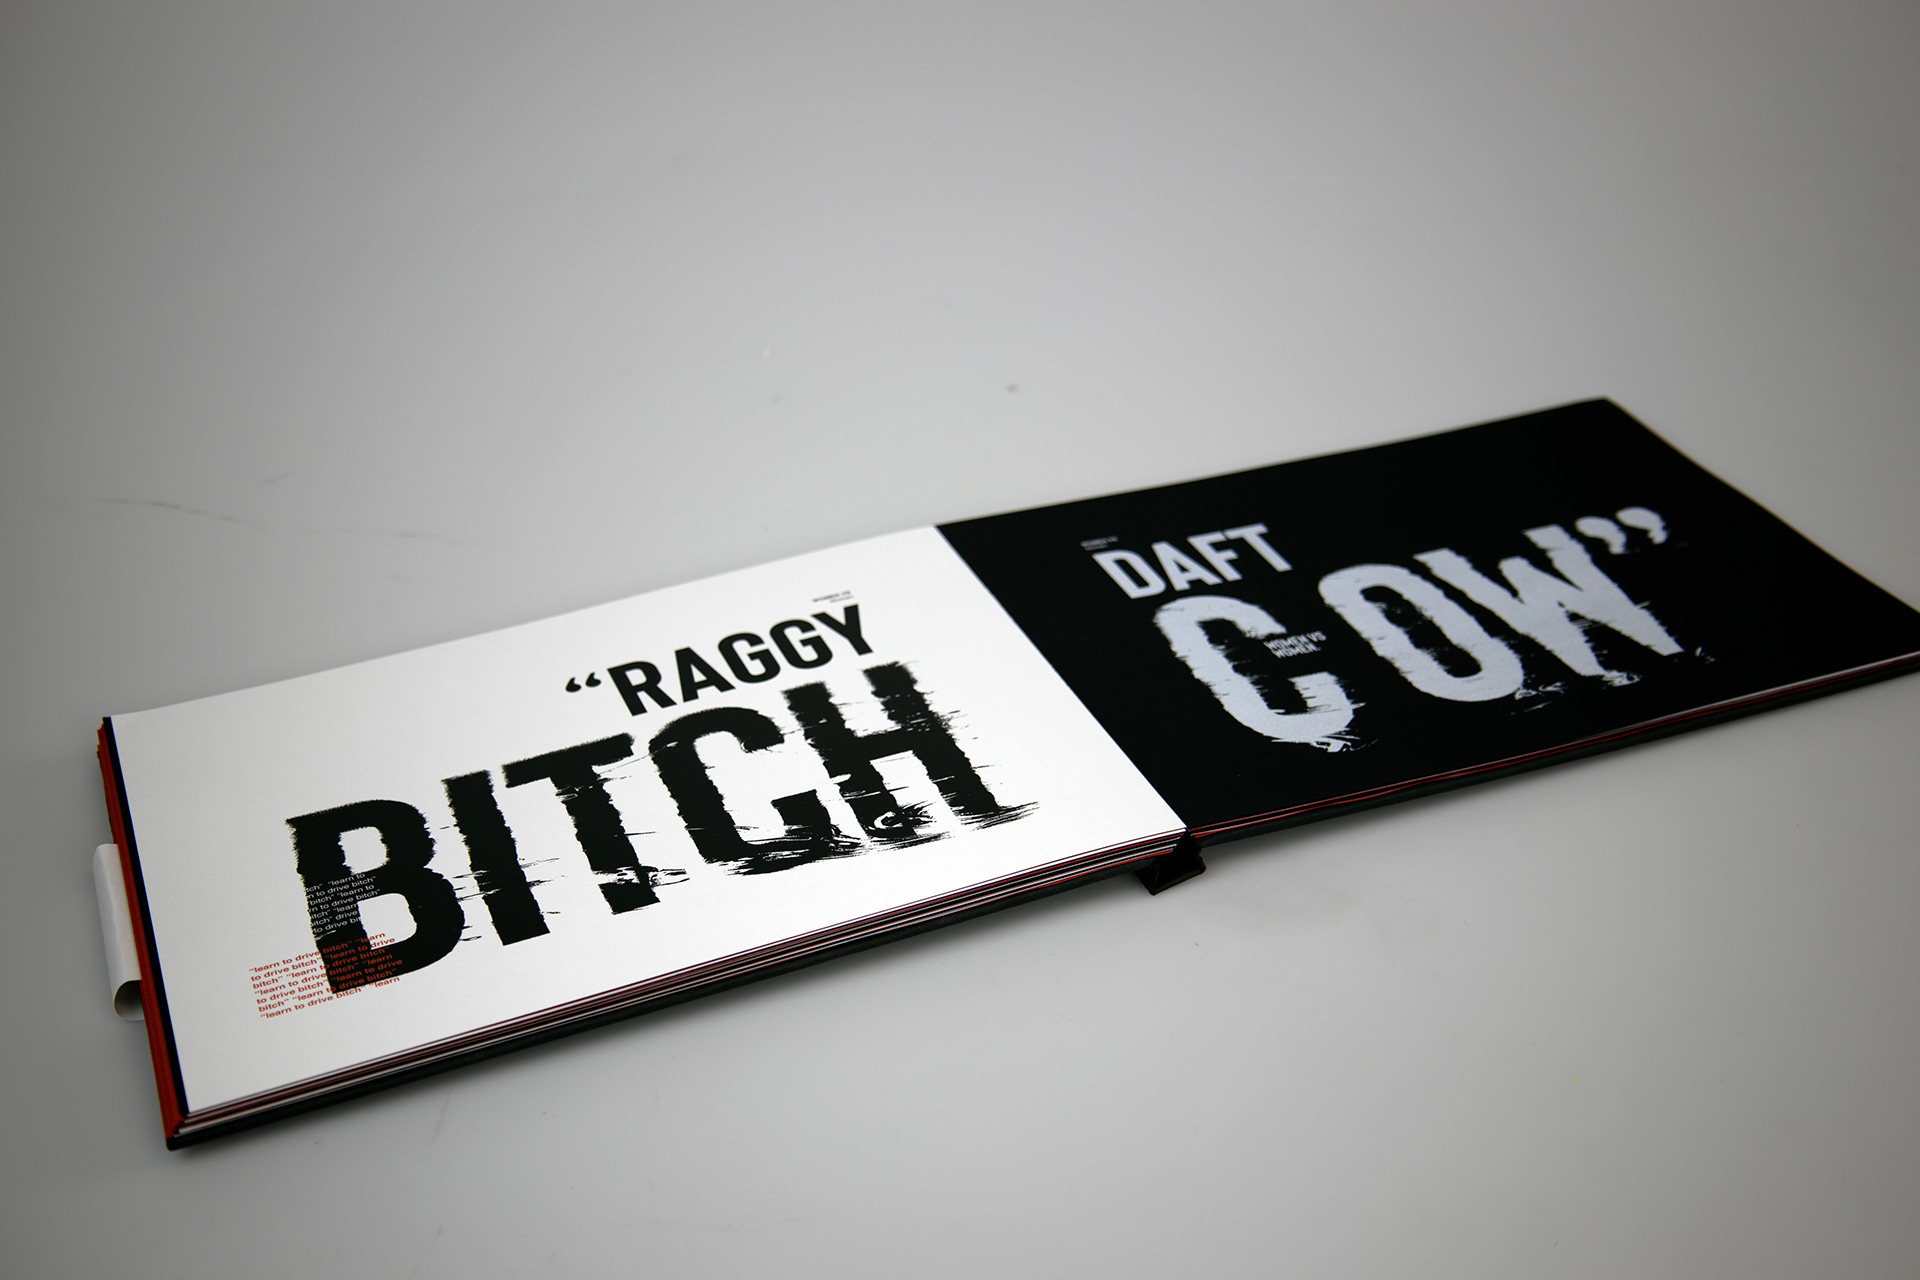
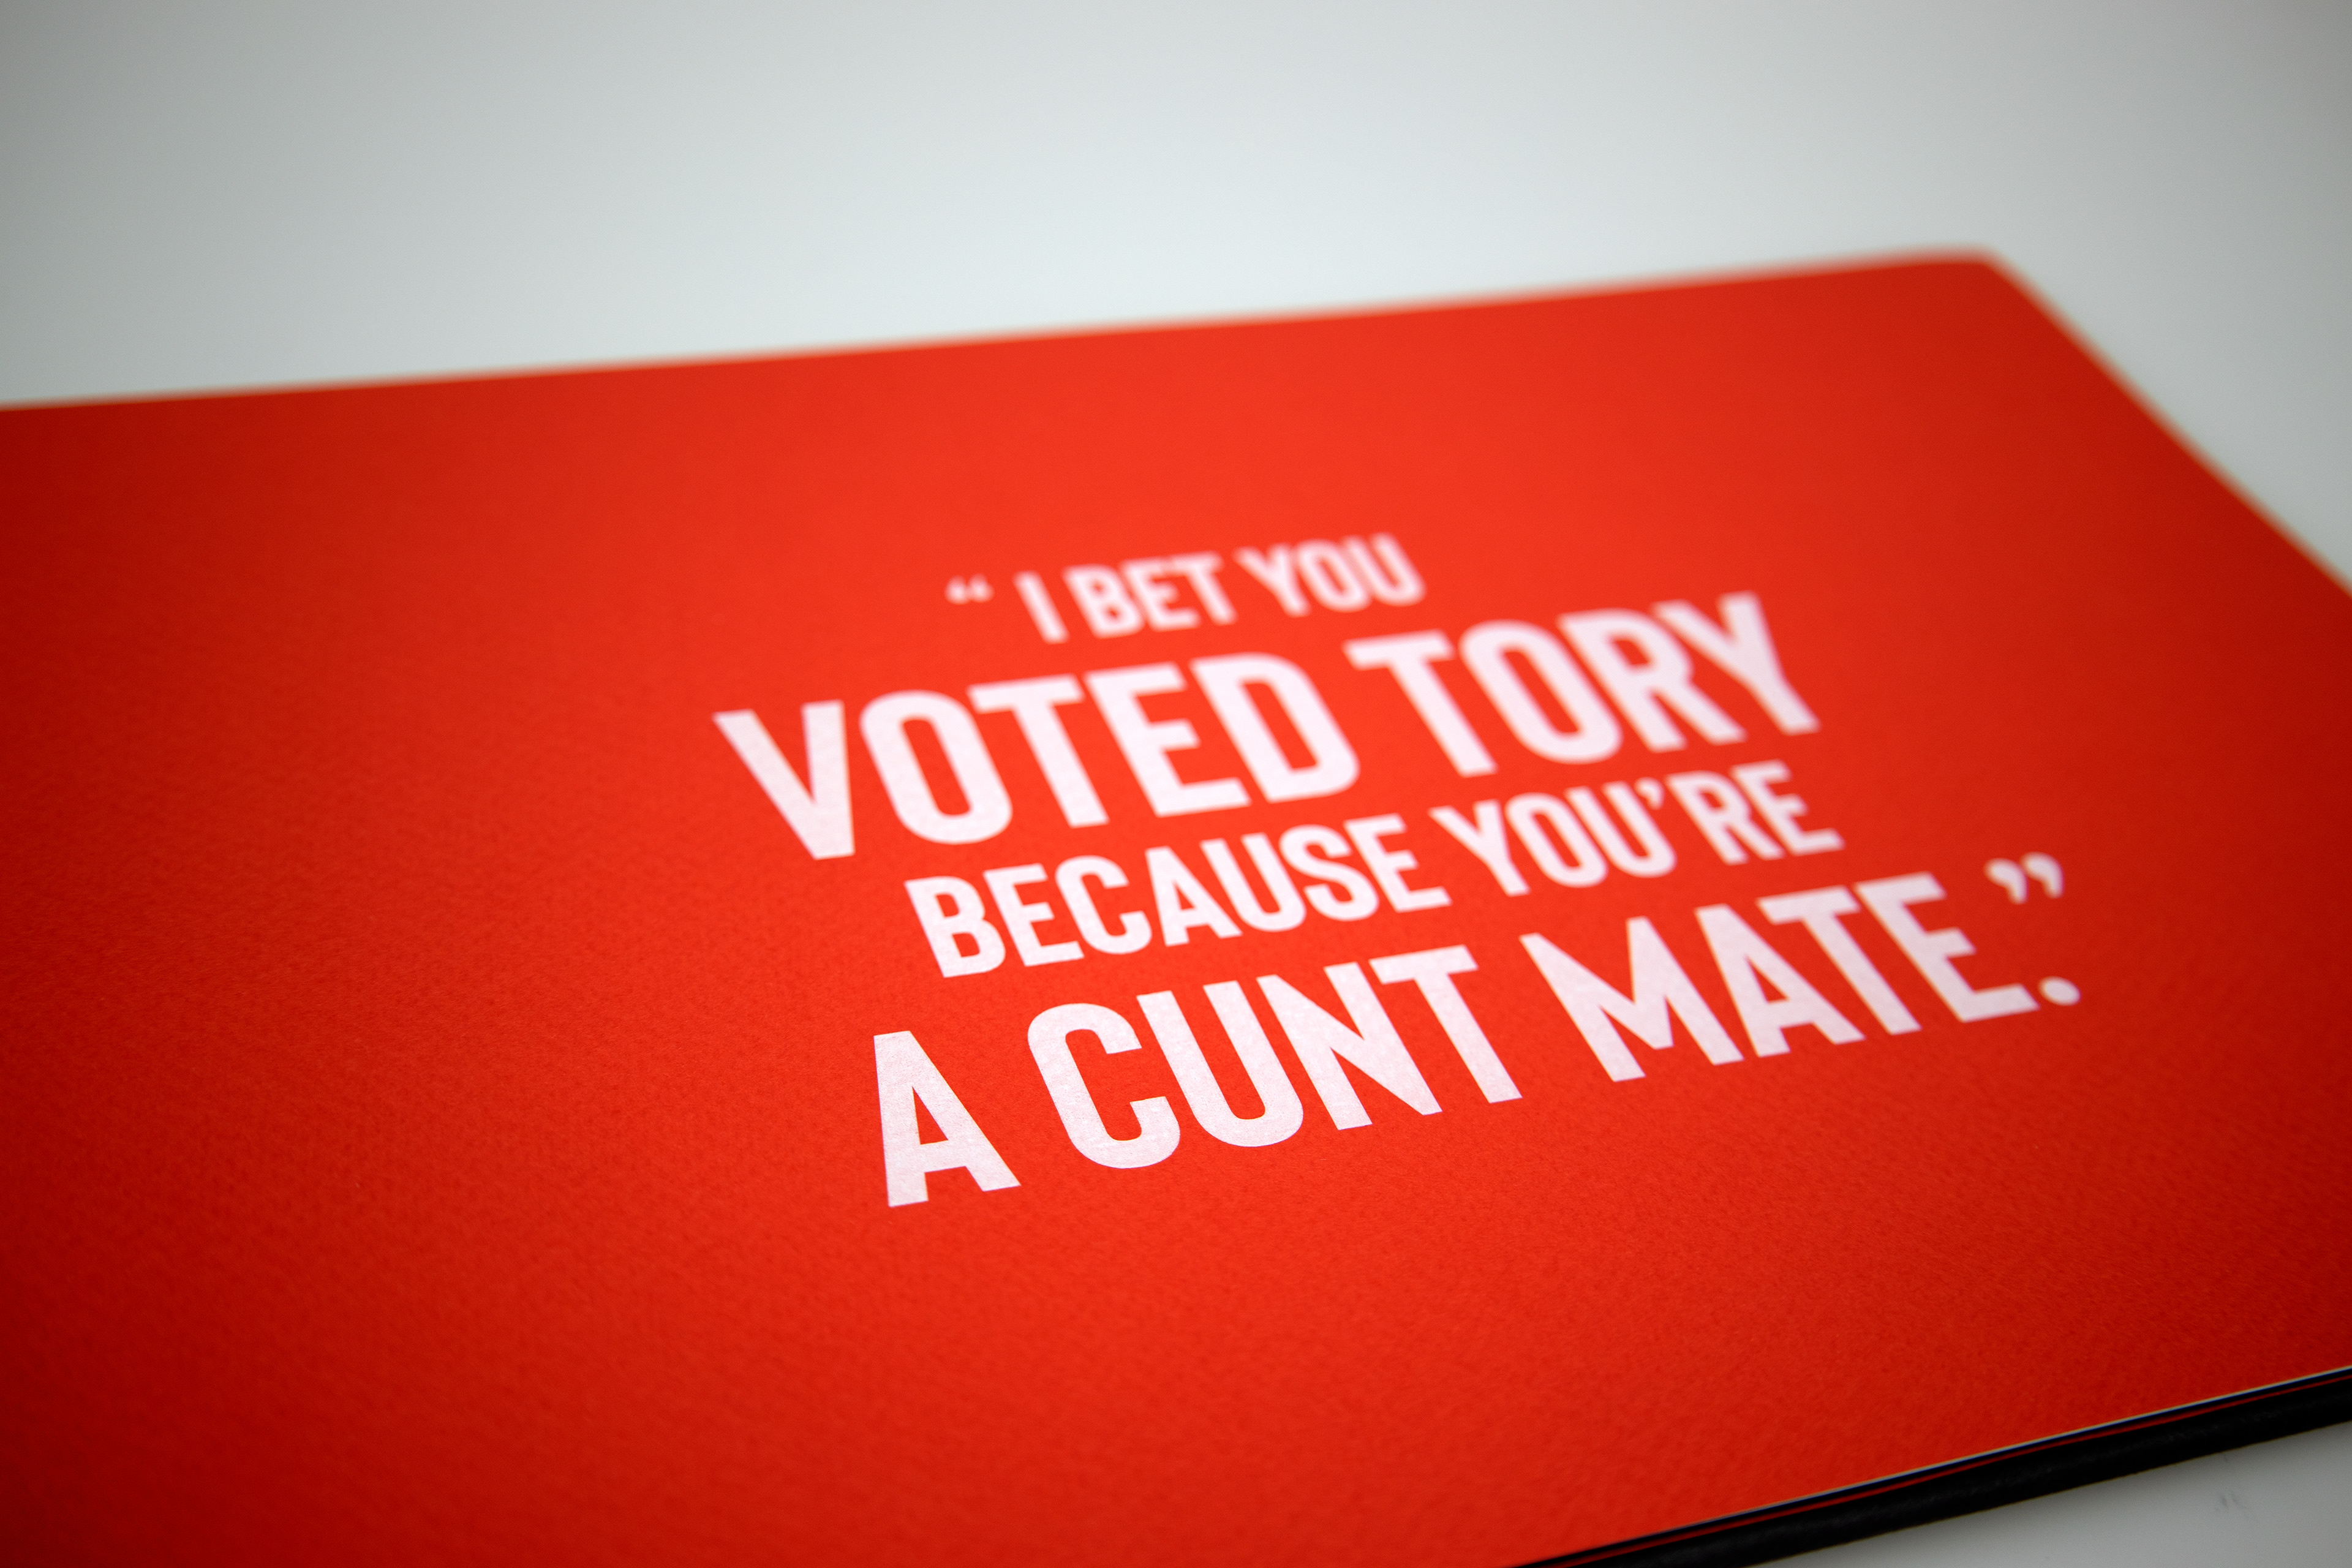
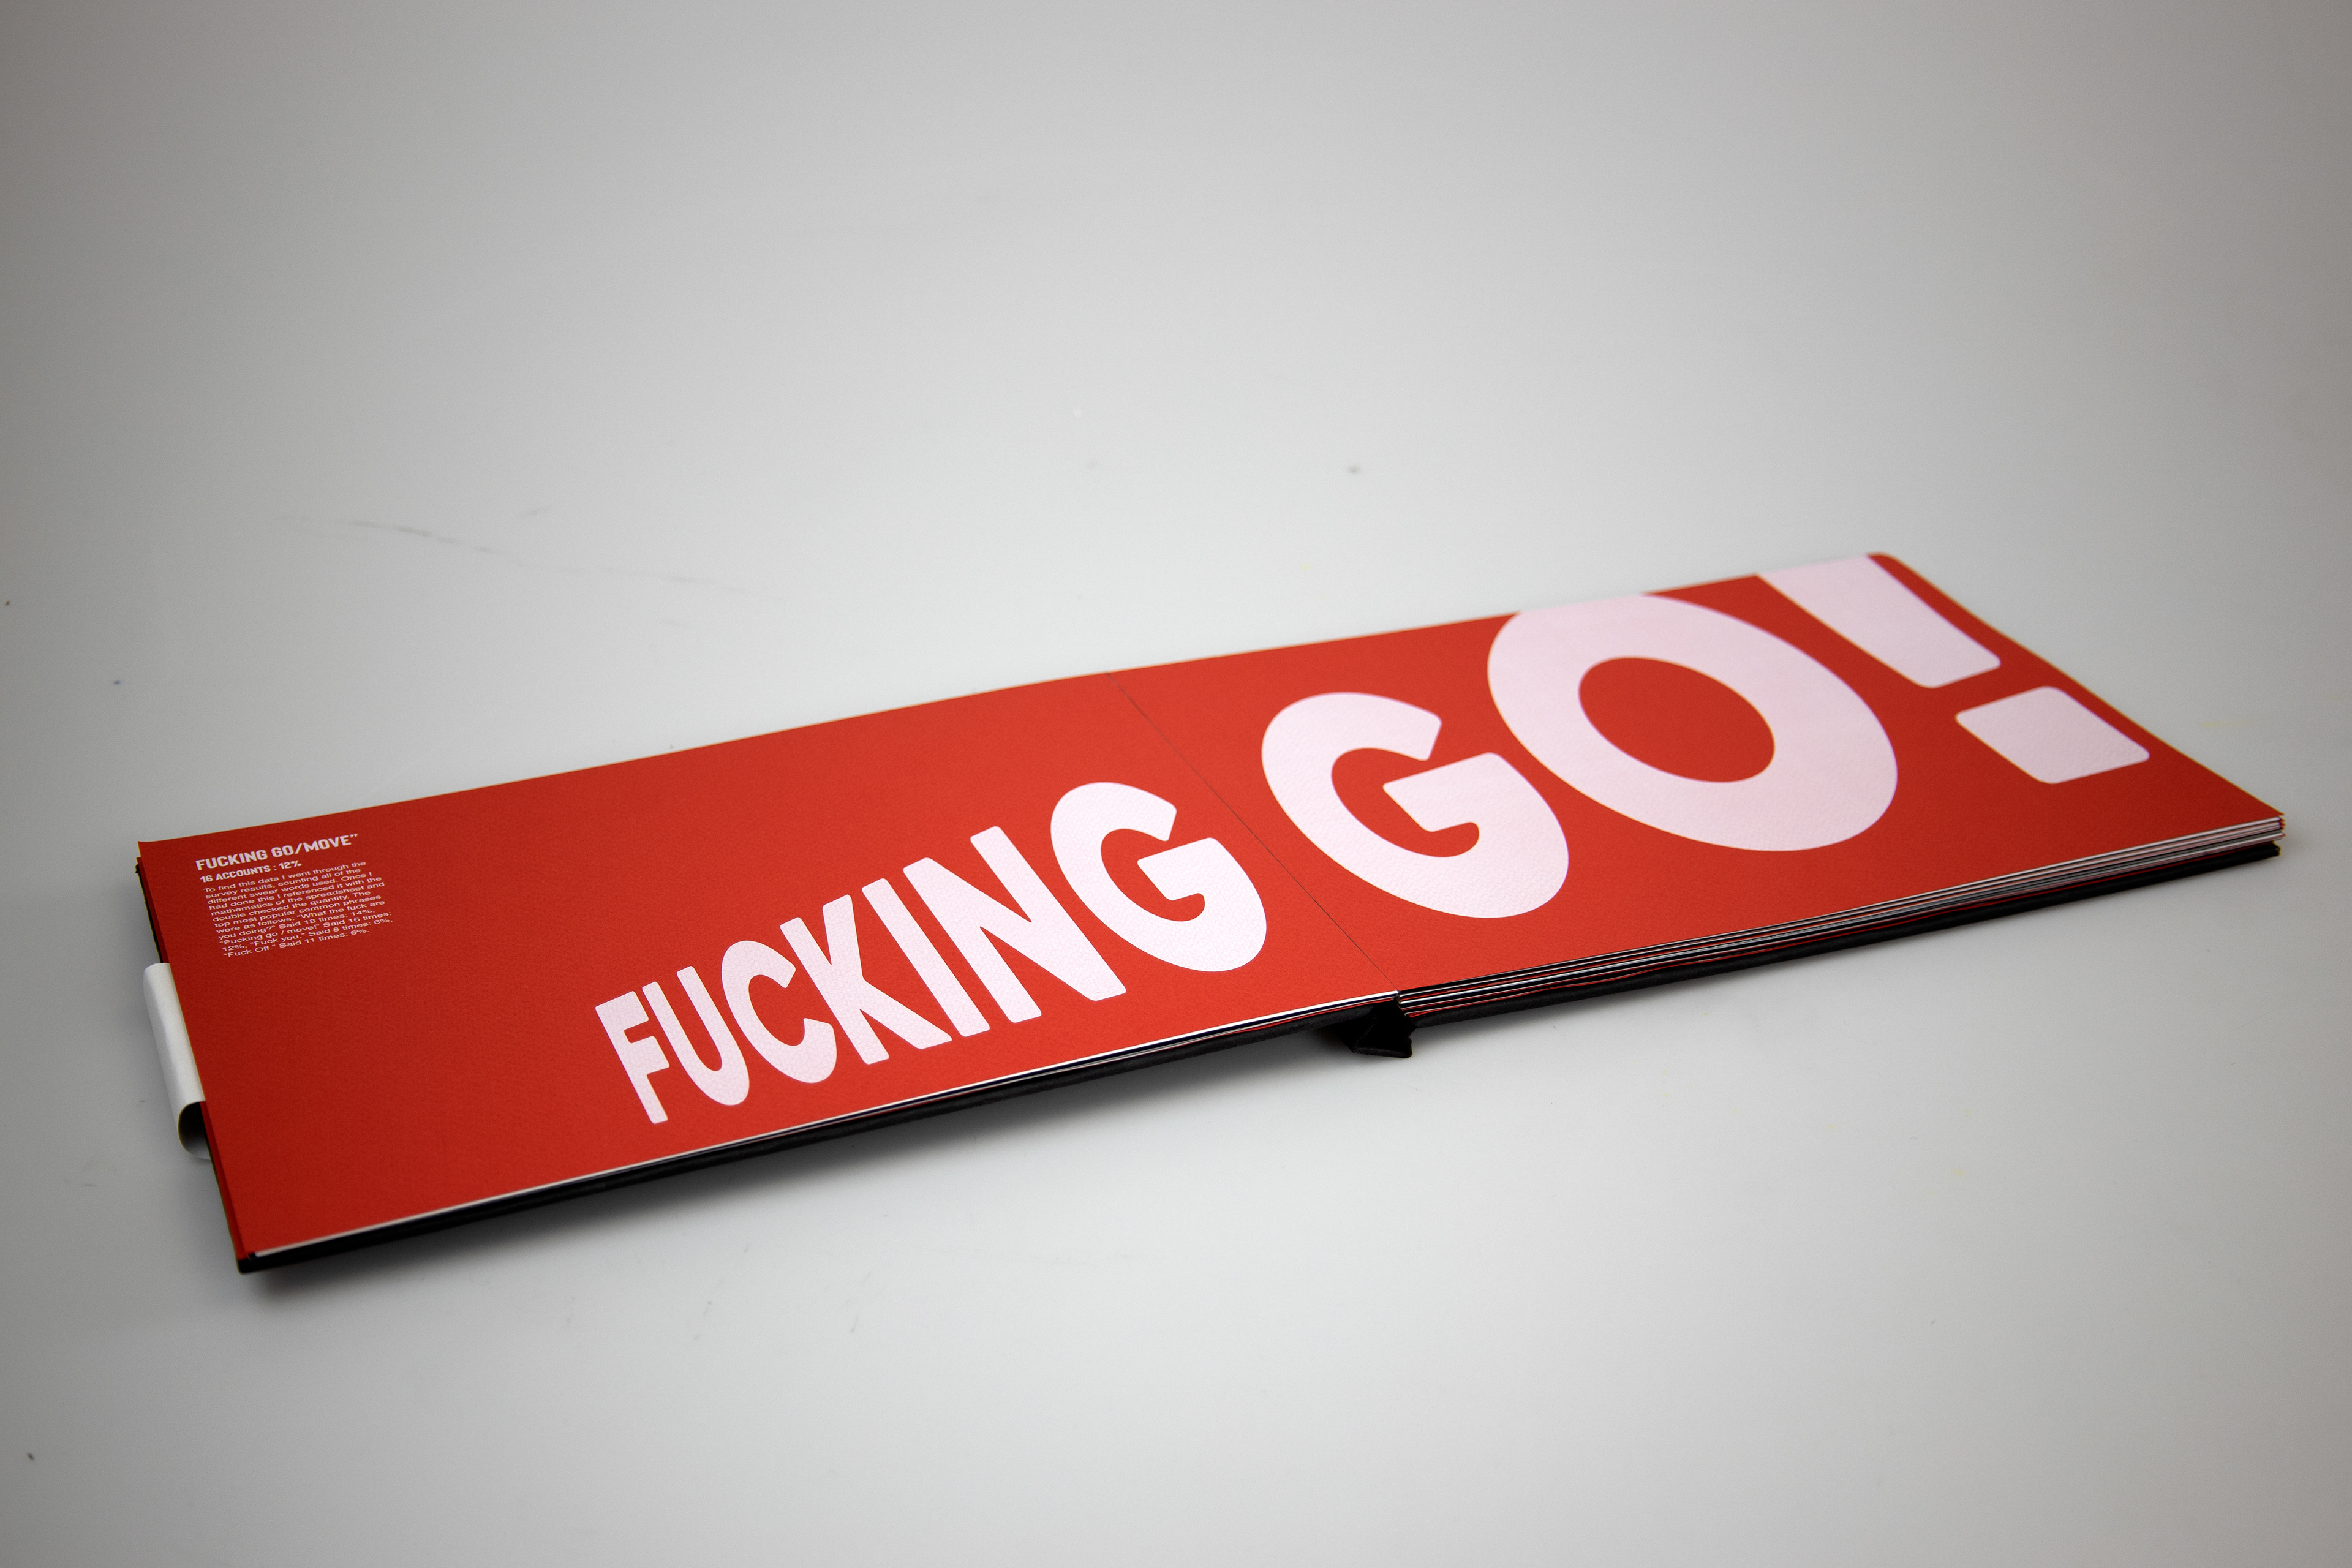
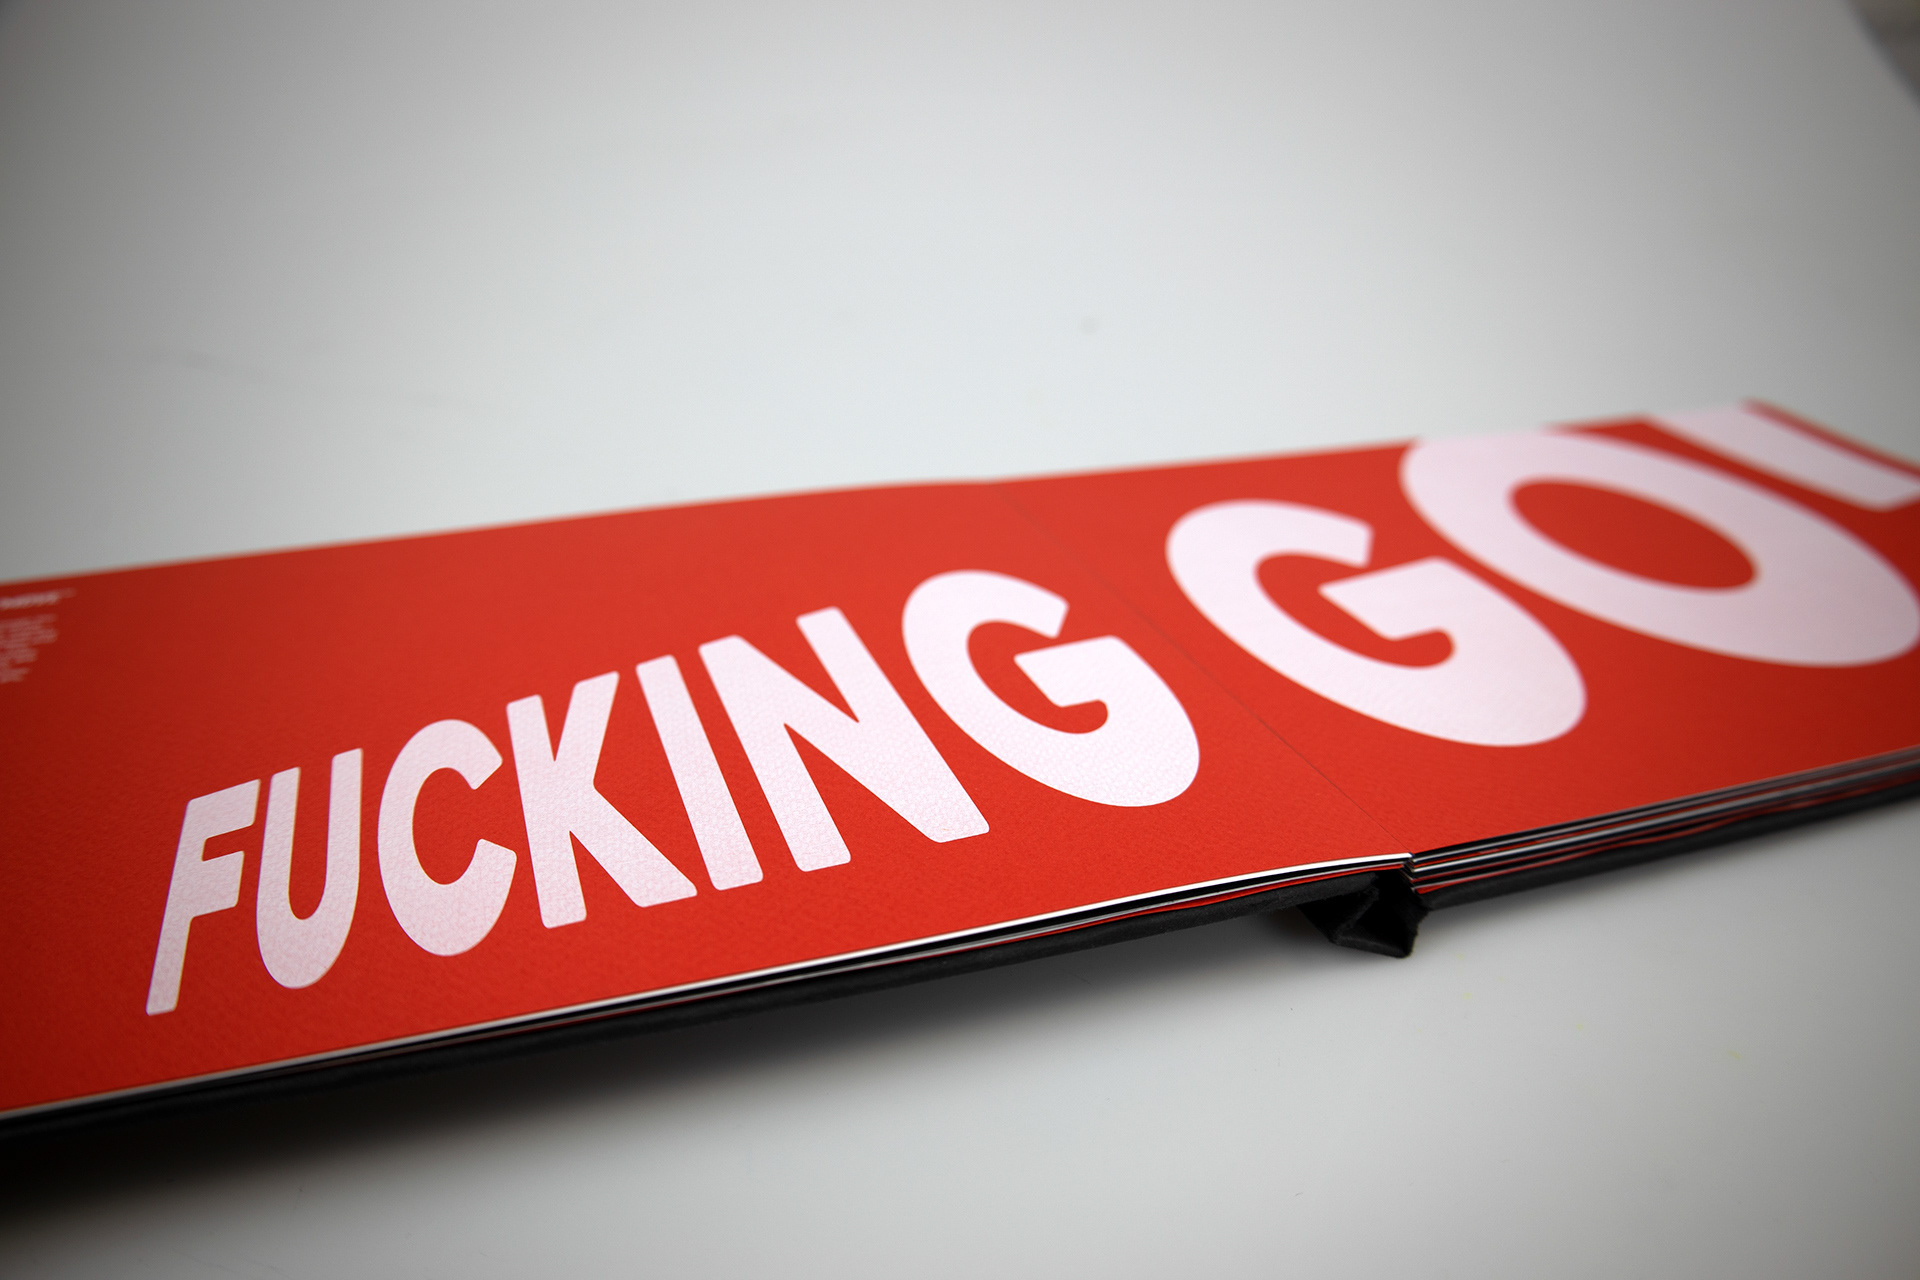
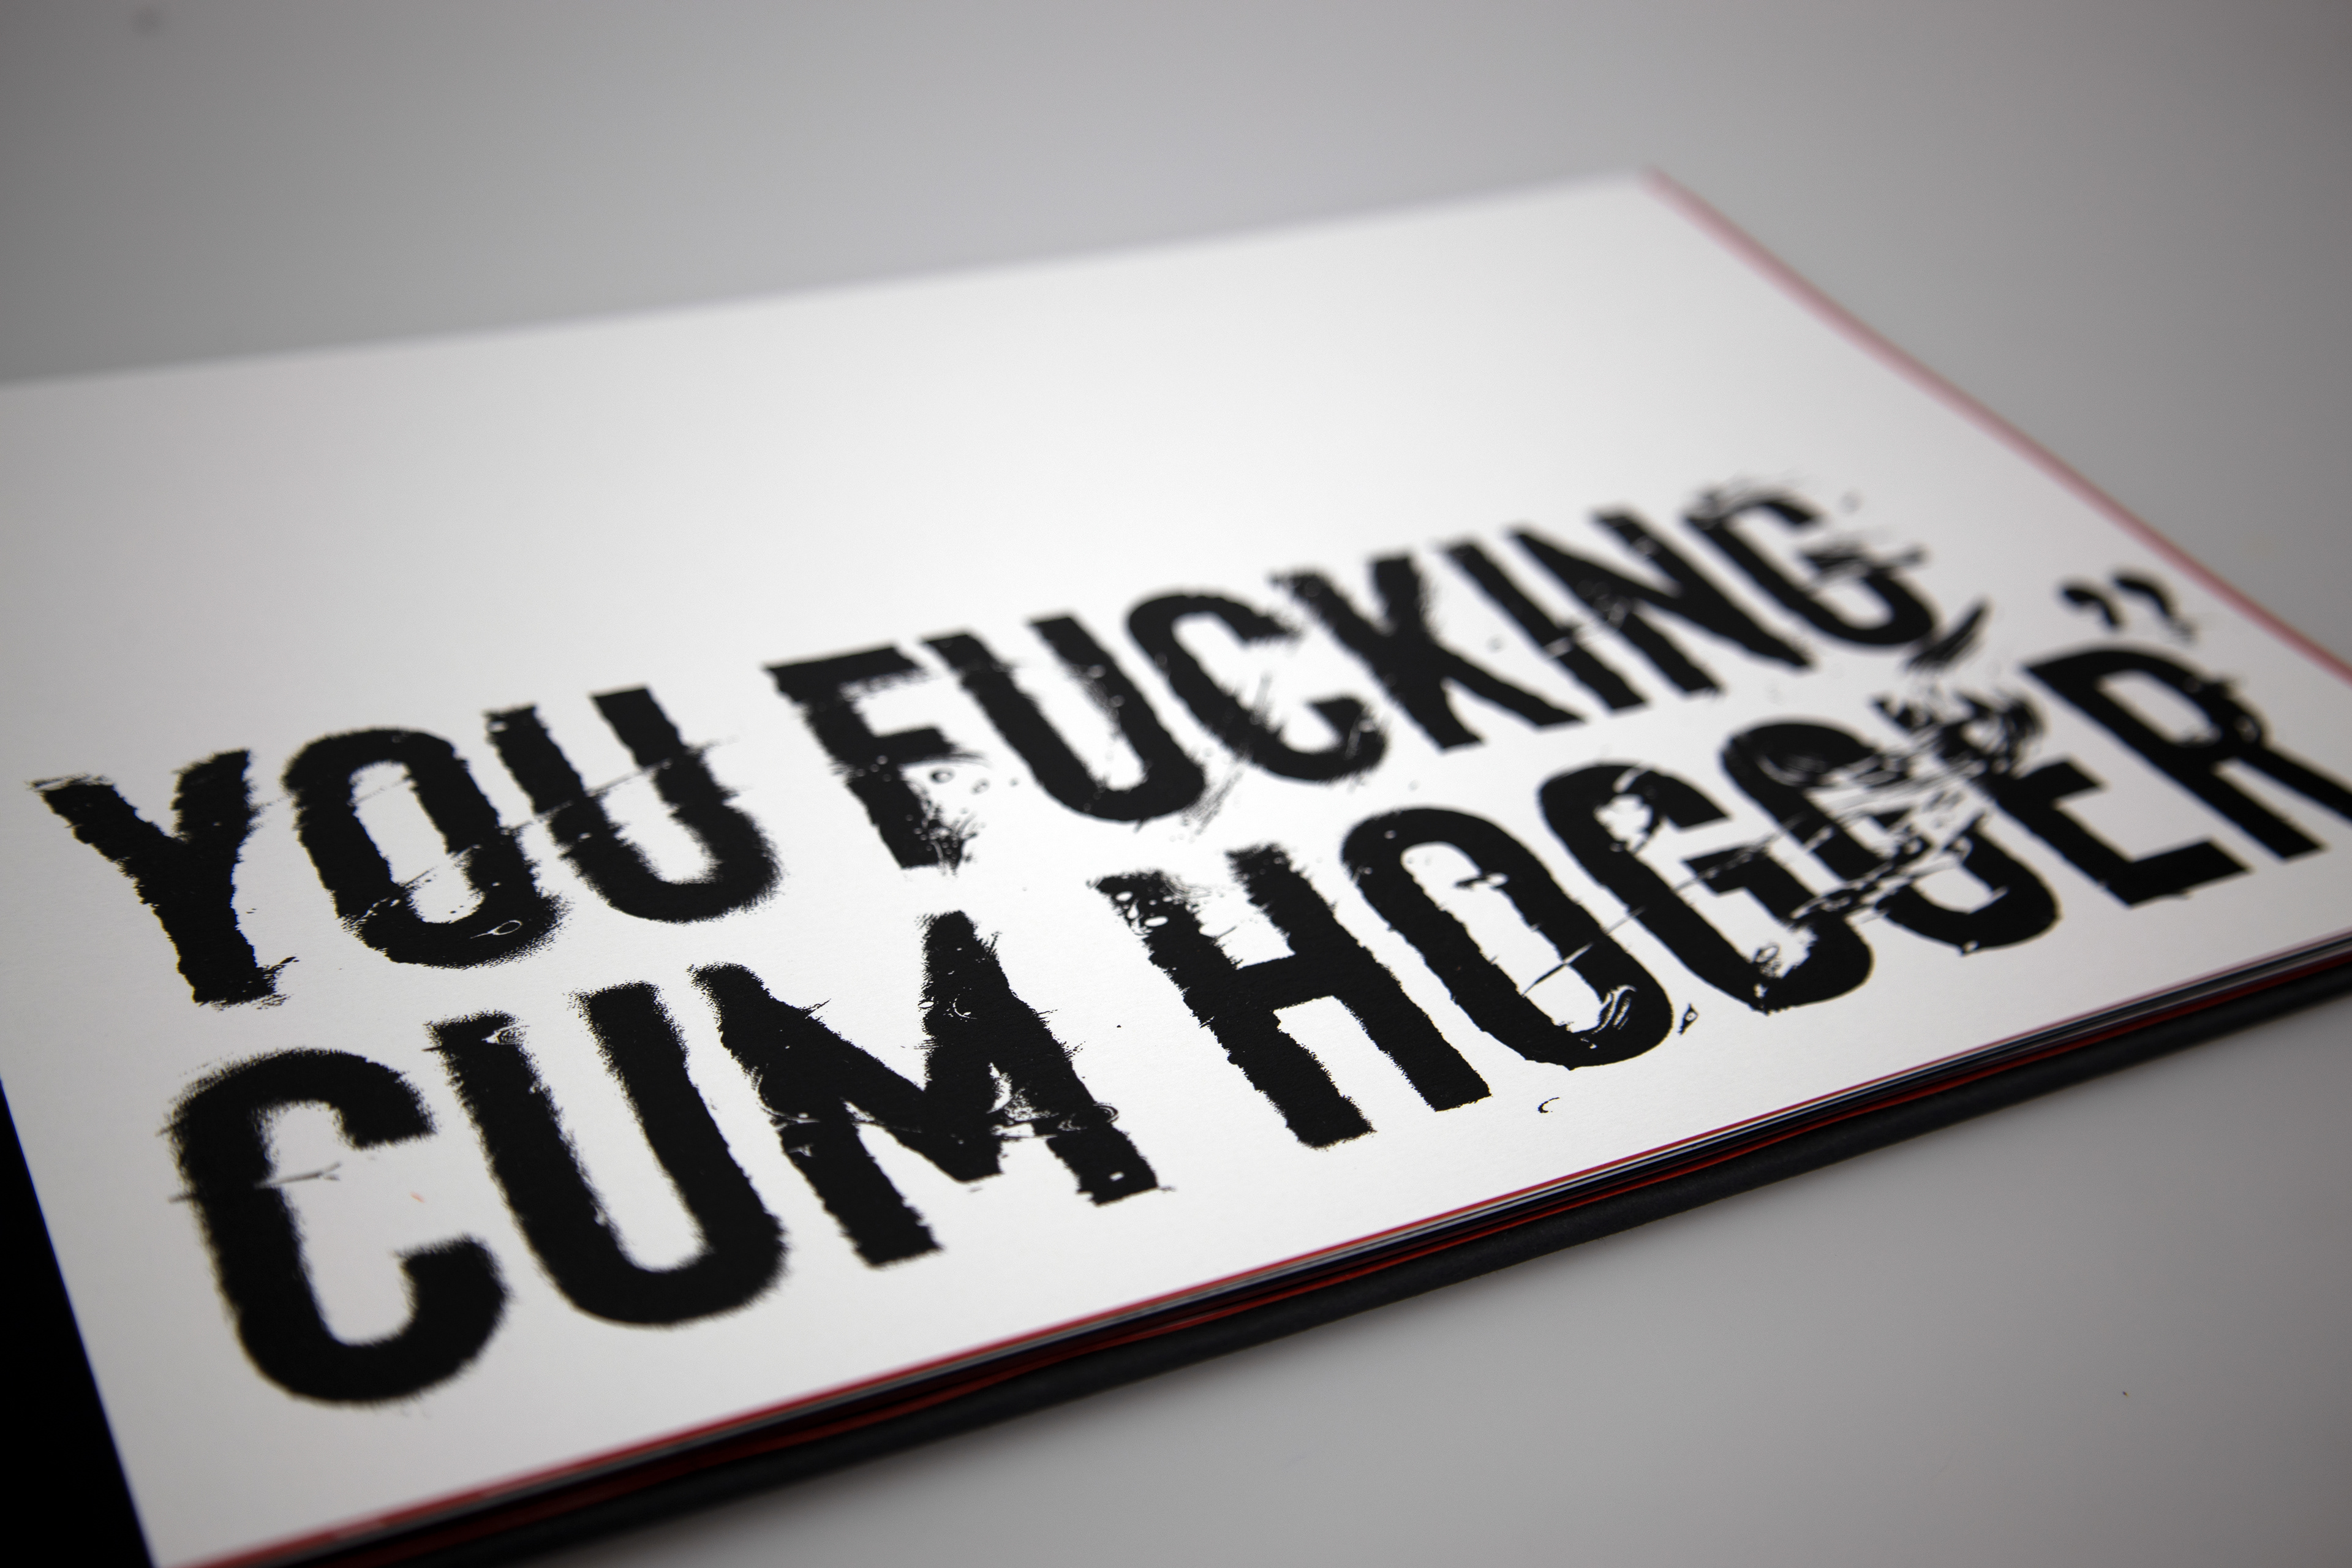
Therefore I conducted a large primary survey, noting a range of factors to linguistically analyse, concluding on both qualitative and quantitative themes. The results of this I then turned into an expressive publication, discussing the discovered information whilst playing and experimenting with emotive typography that reflected some of the humorous quotes featured in the extensive survey.
Data Handling, Data Analysis, Typography, Editorial , Primary Research


The Survey
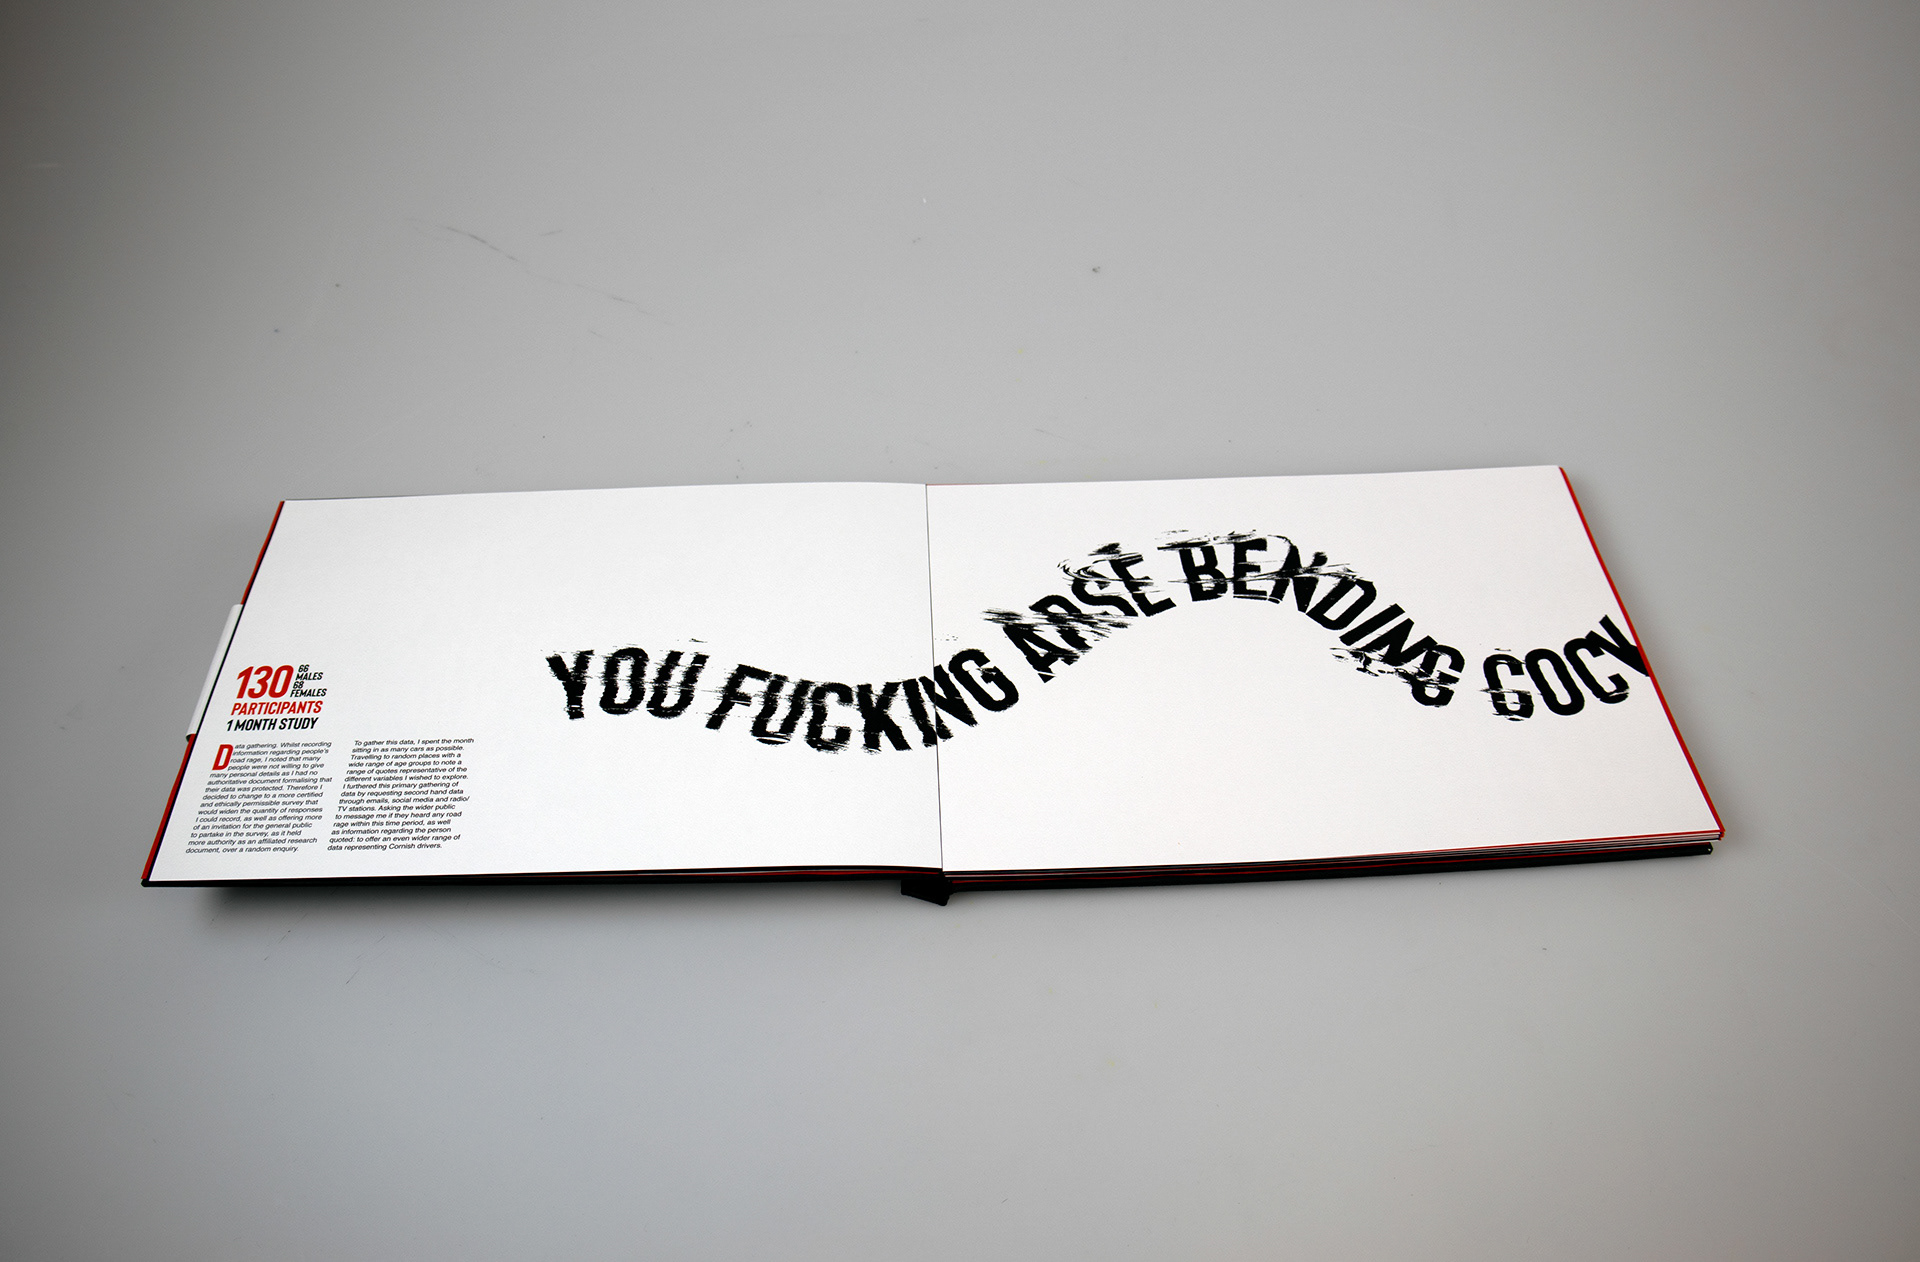
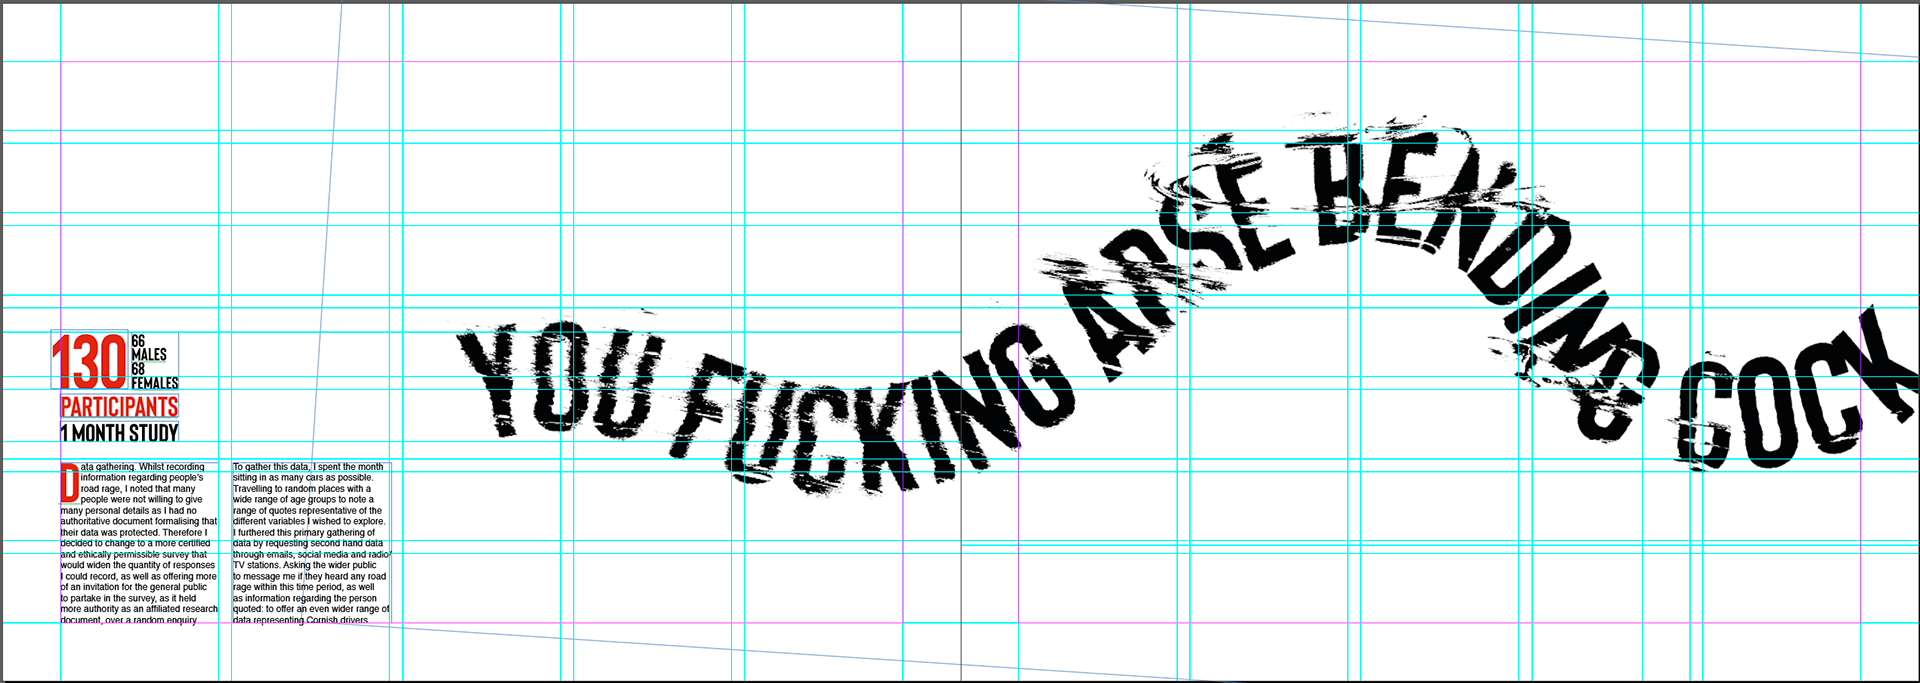
130 participants: 66 males, 66 females
September to October 2020
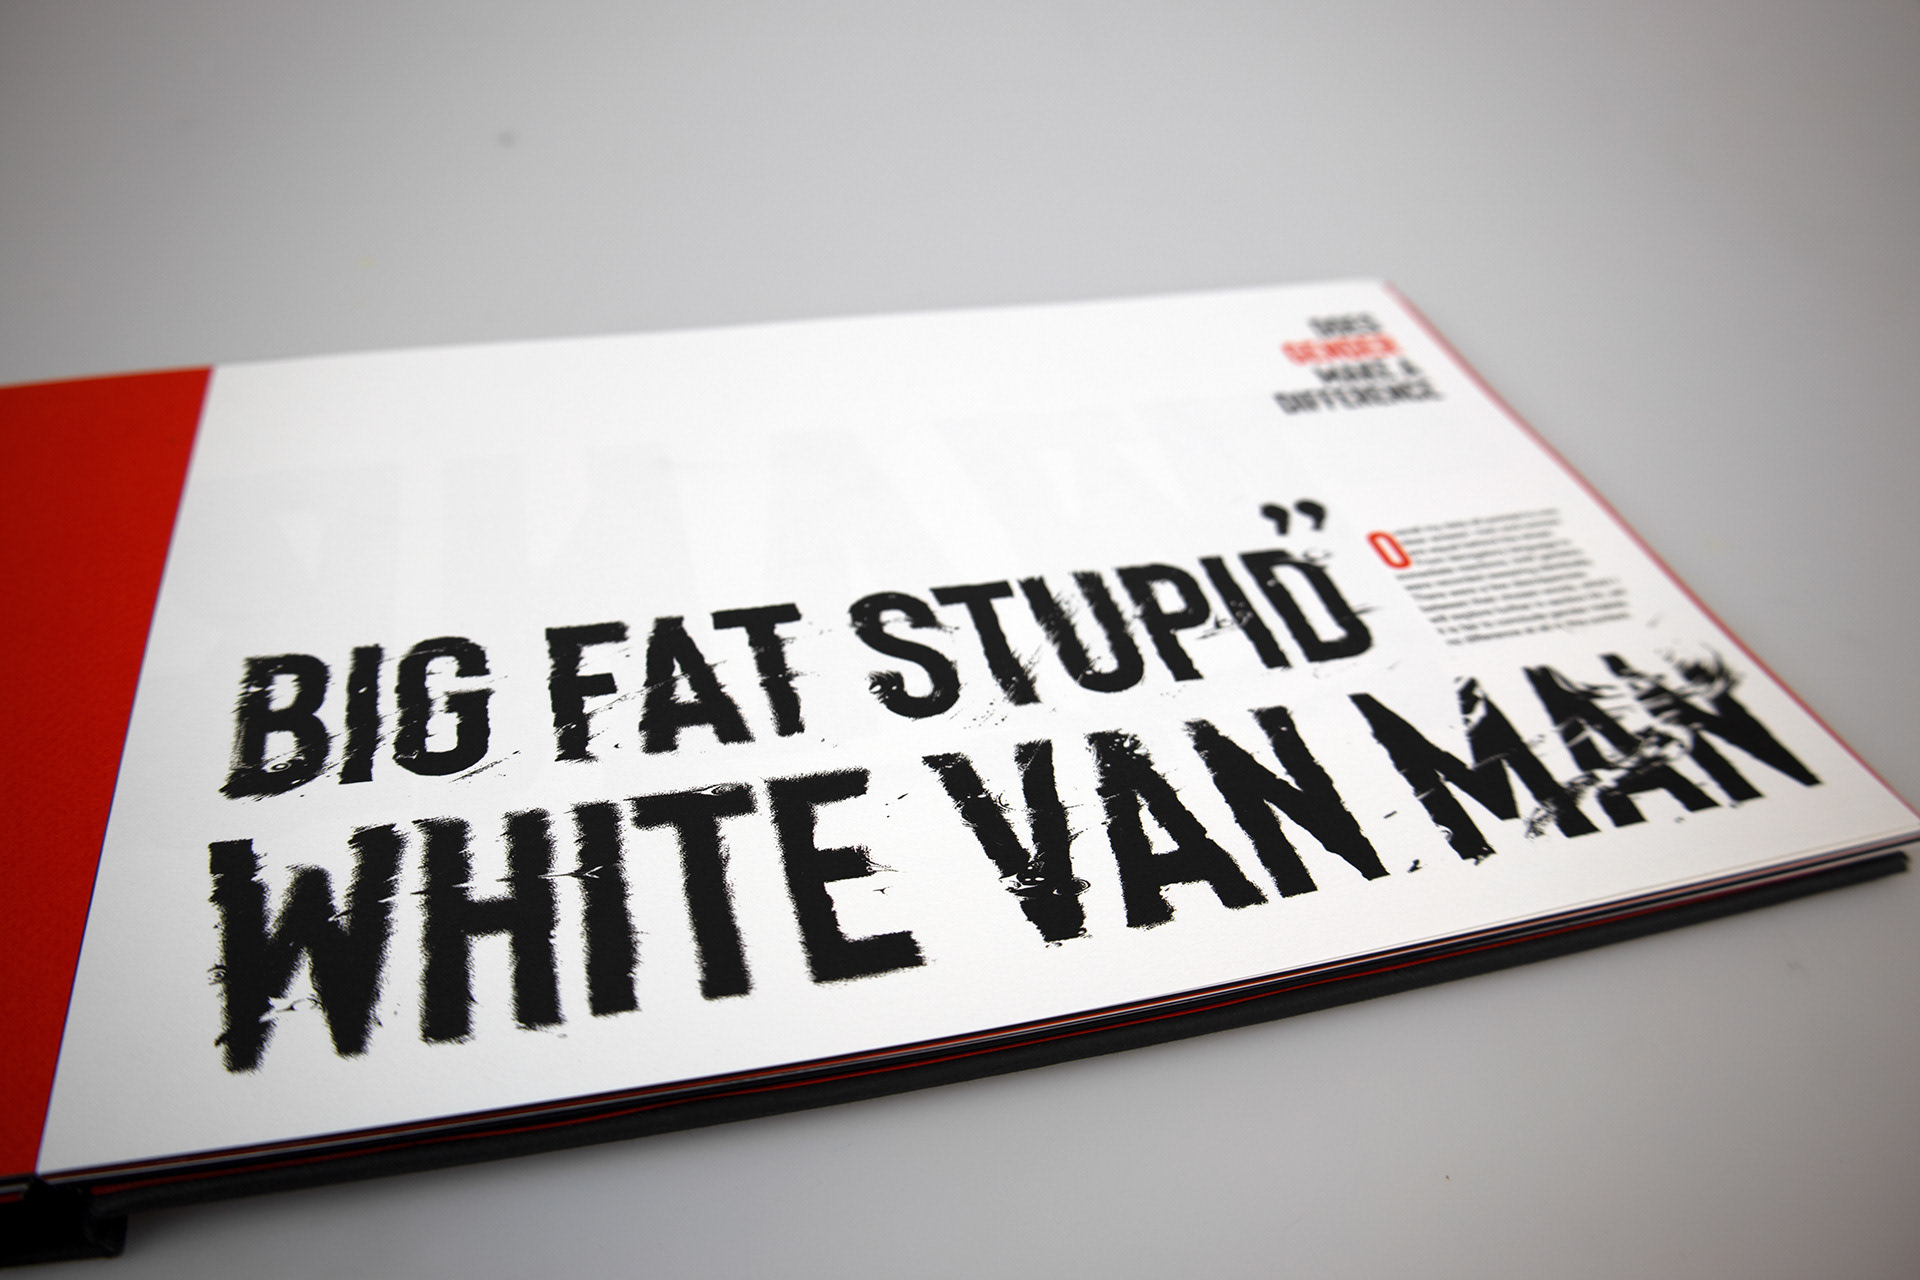
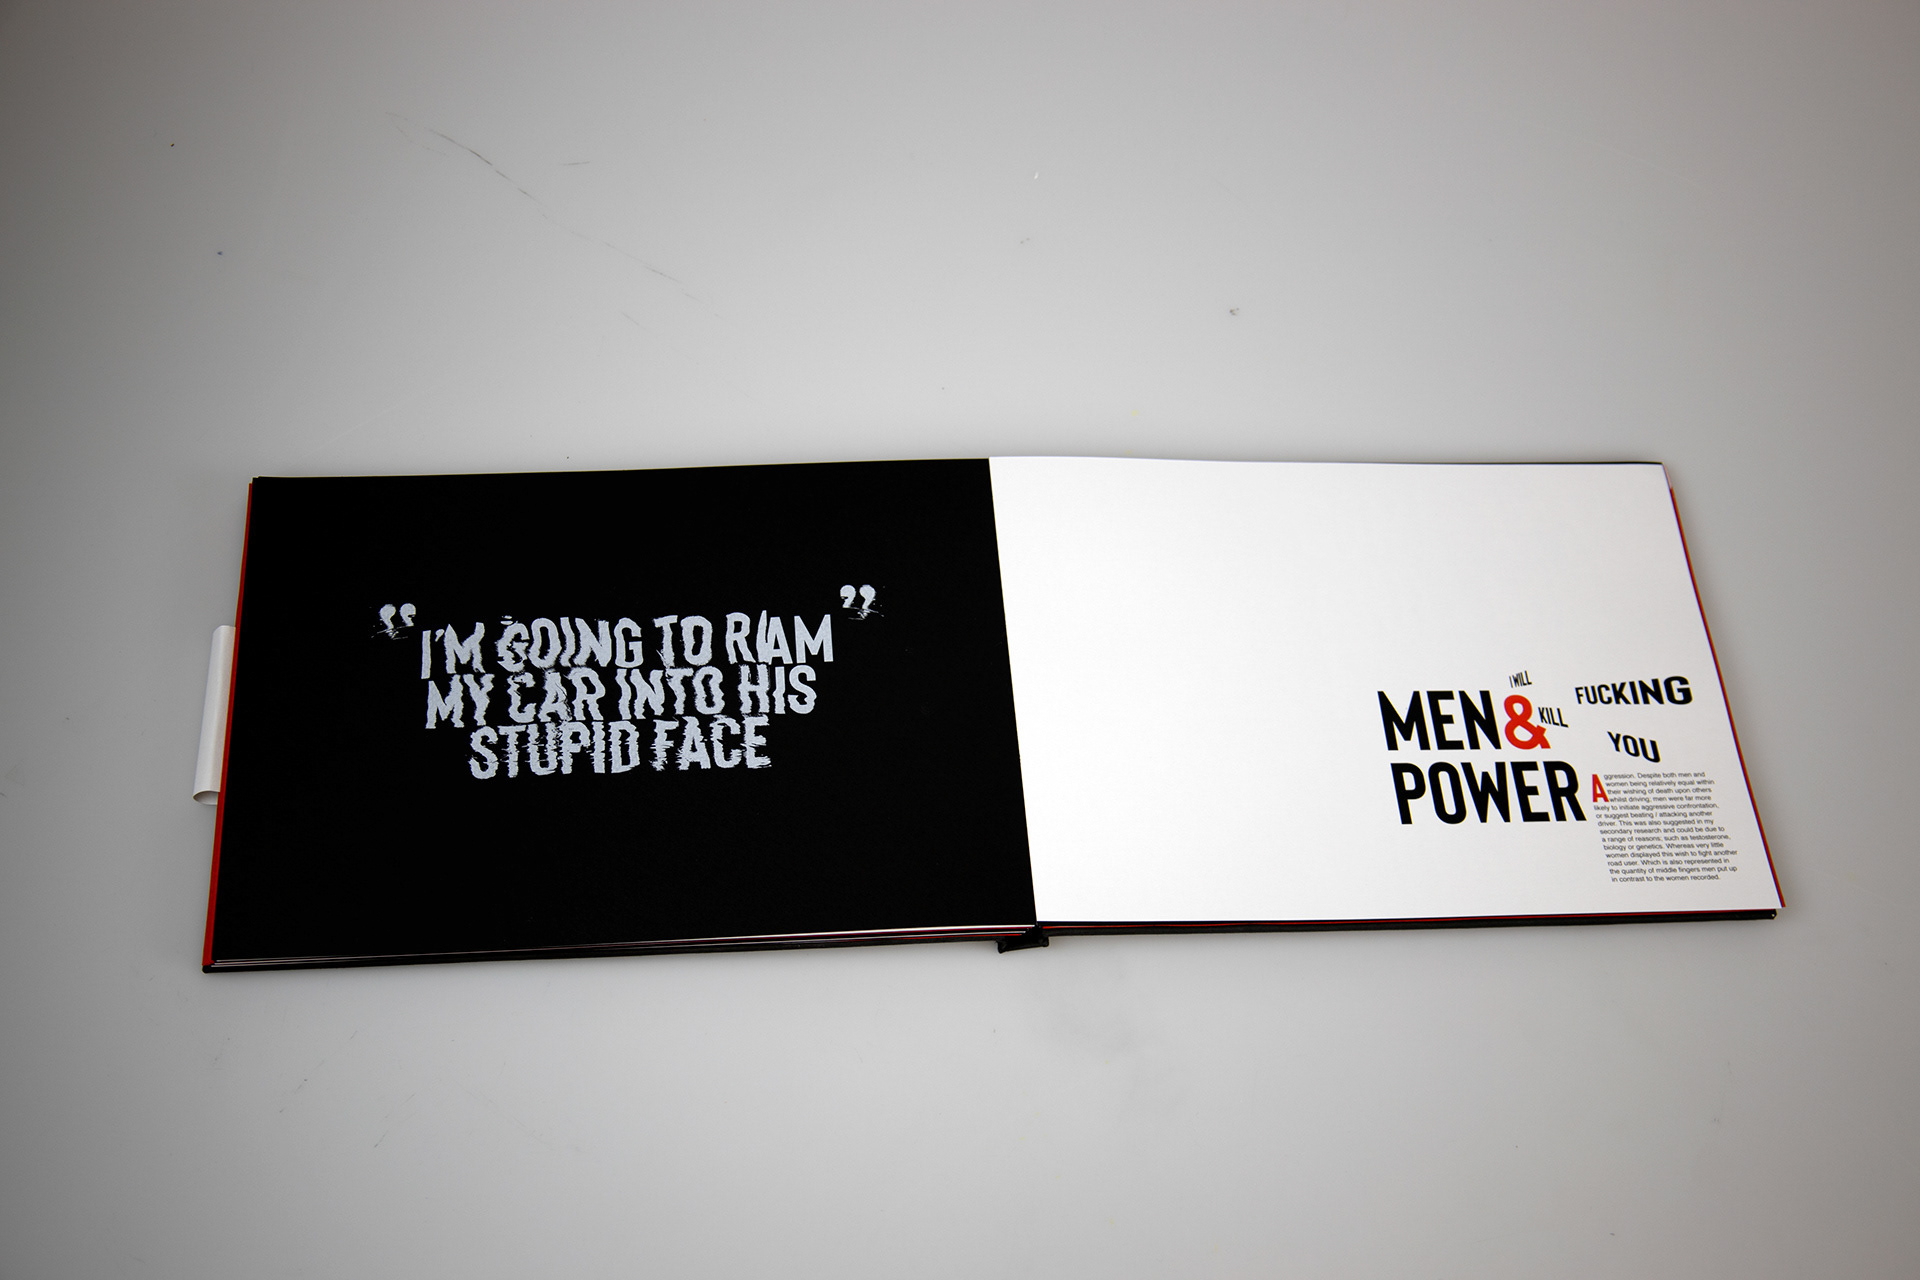
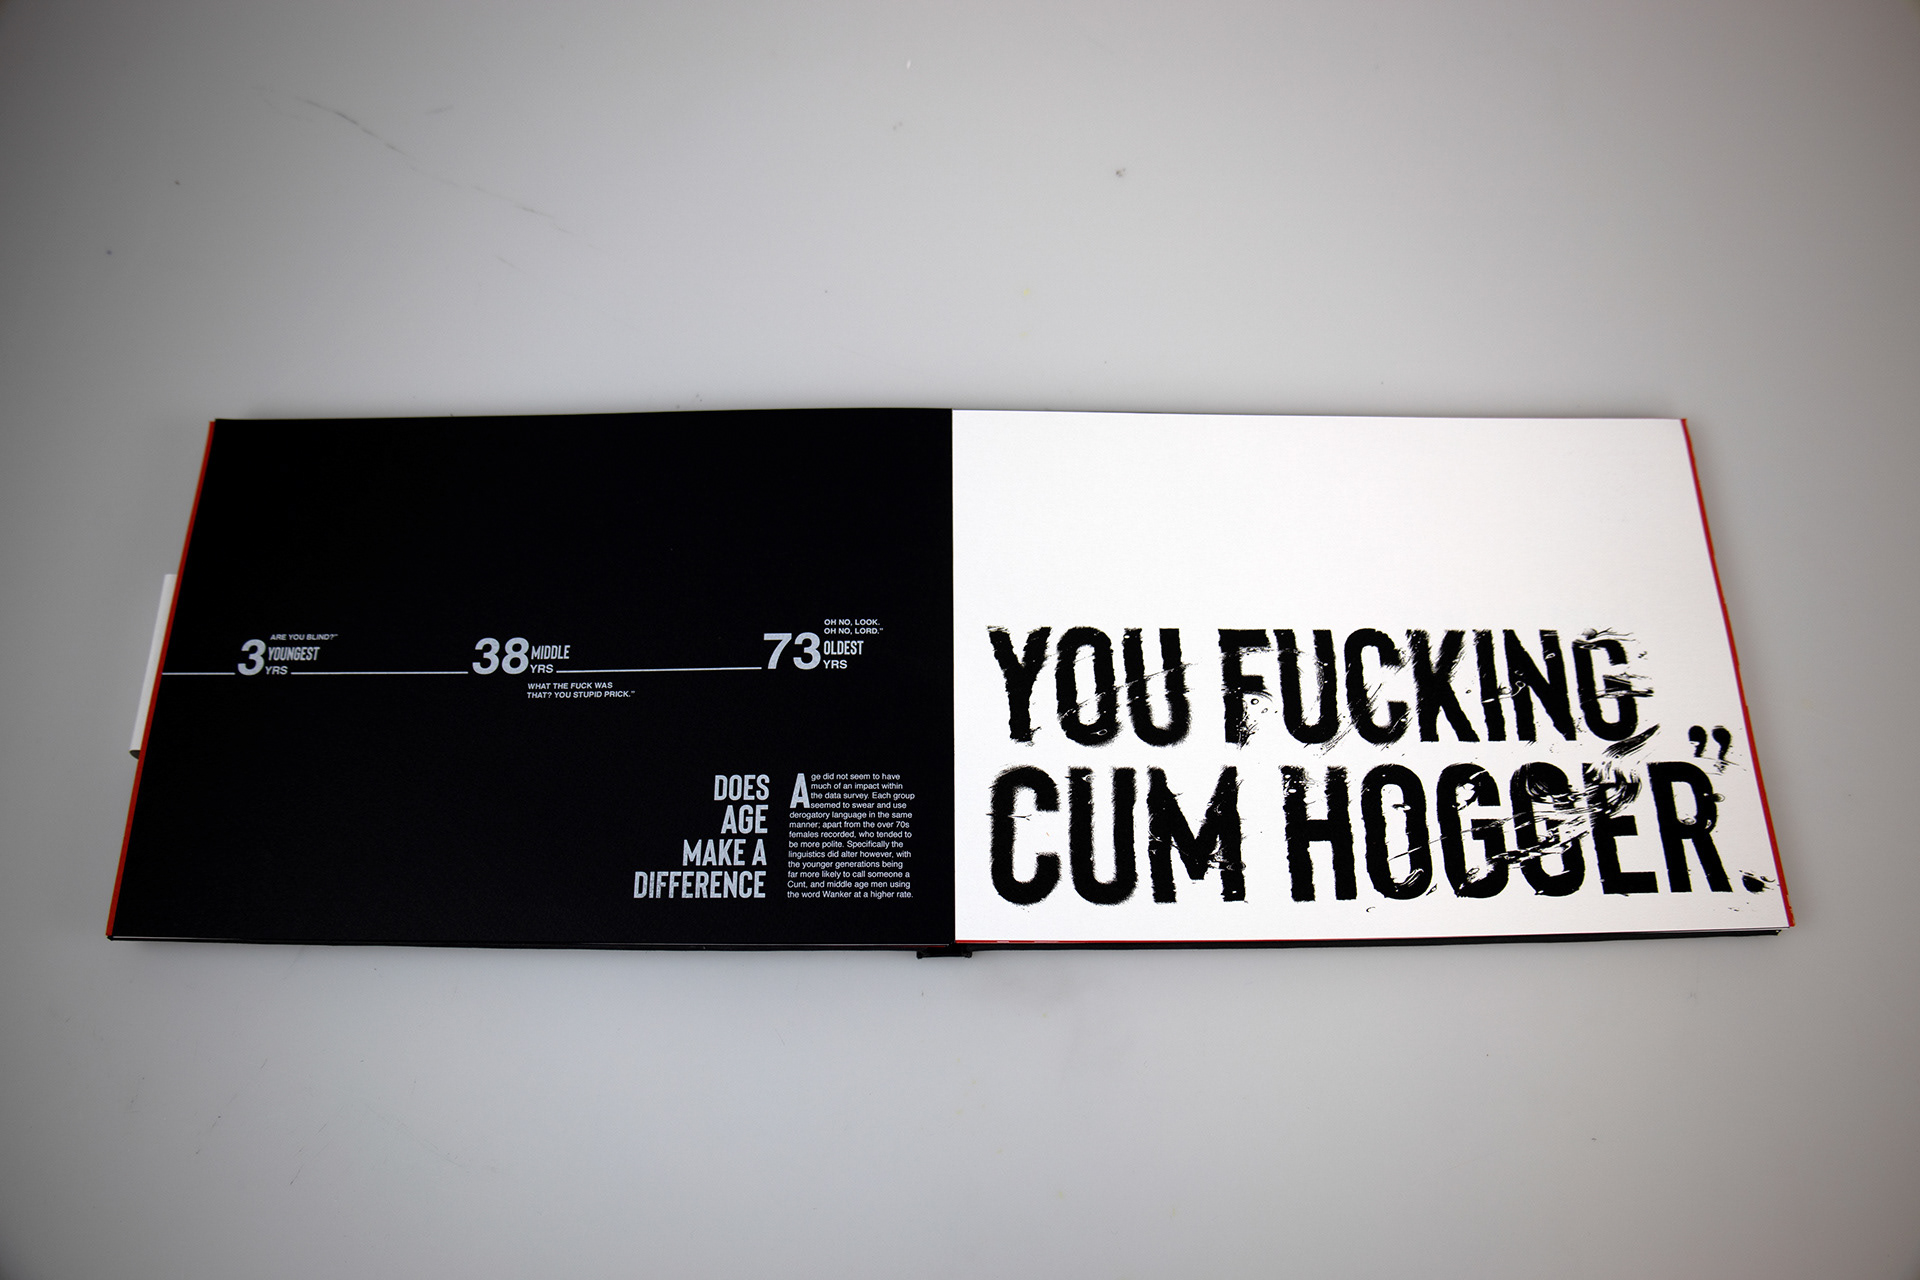
Does age and gender have an impact upon the vocabulary used within a road rage context, and how does this language juxtapose with the participants normal persona?
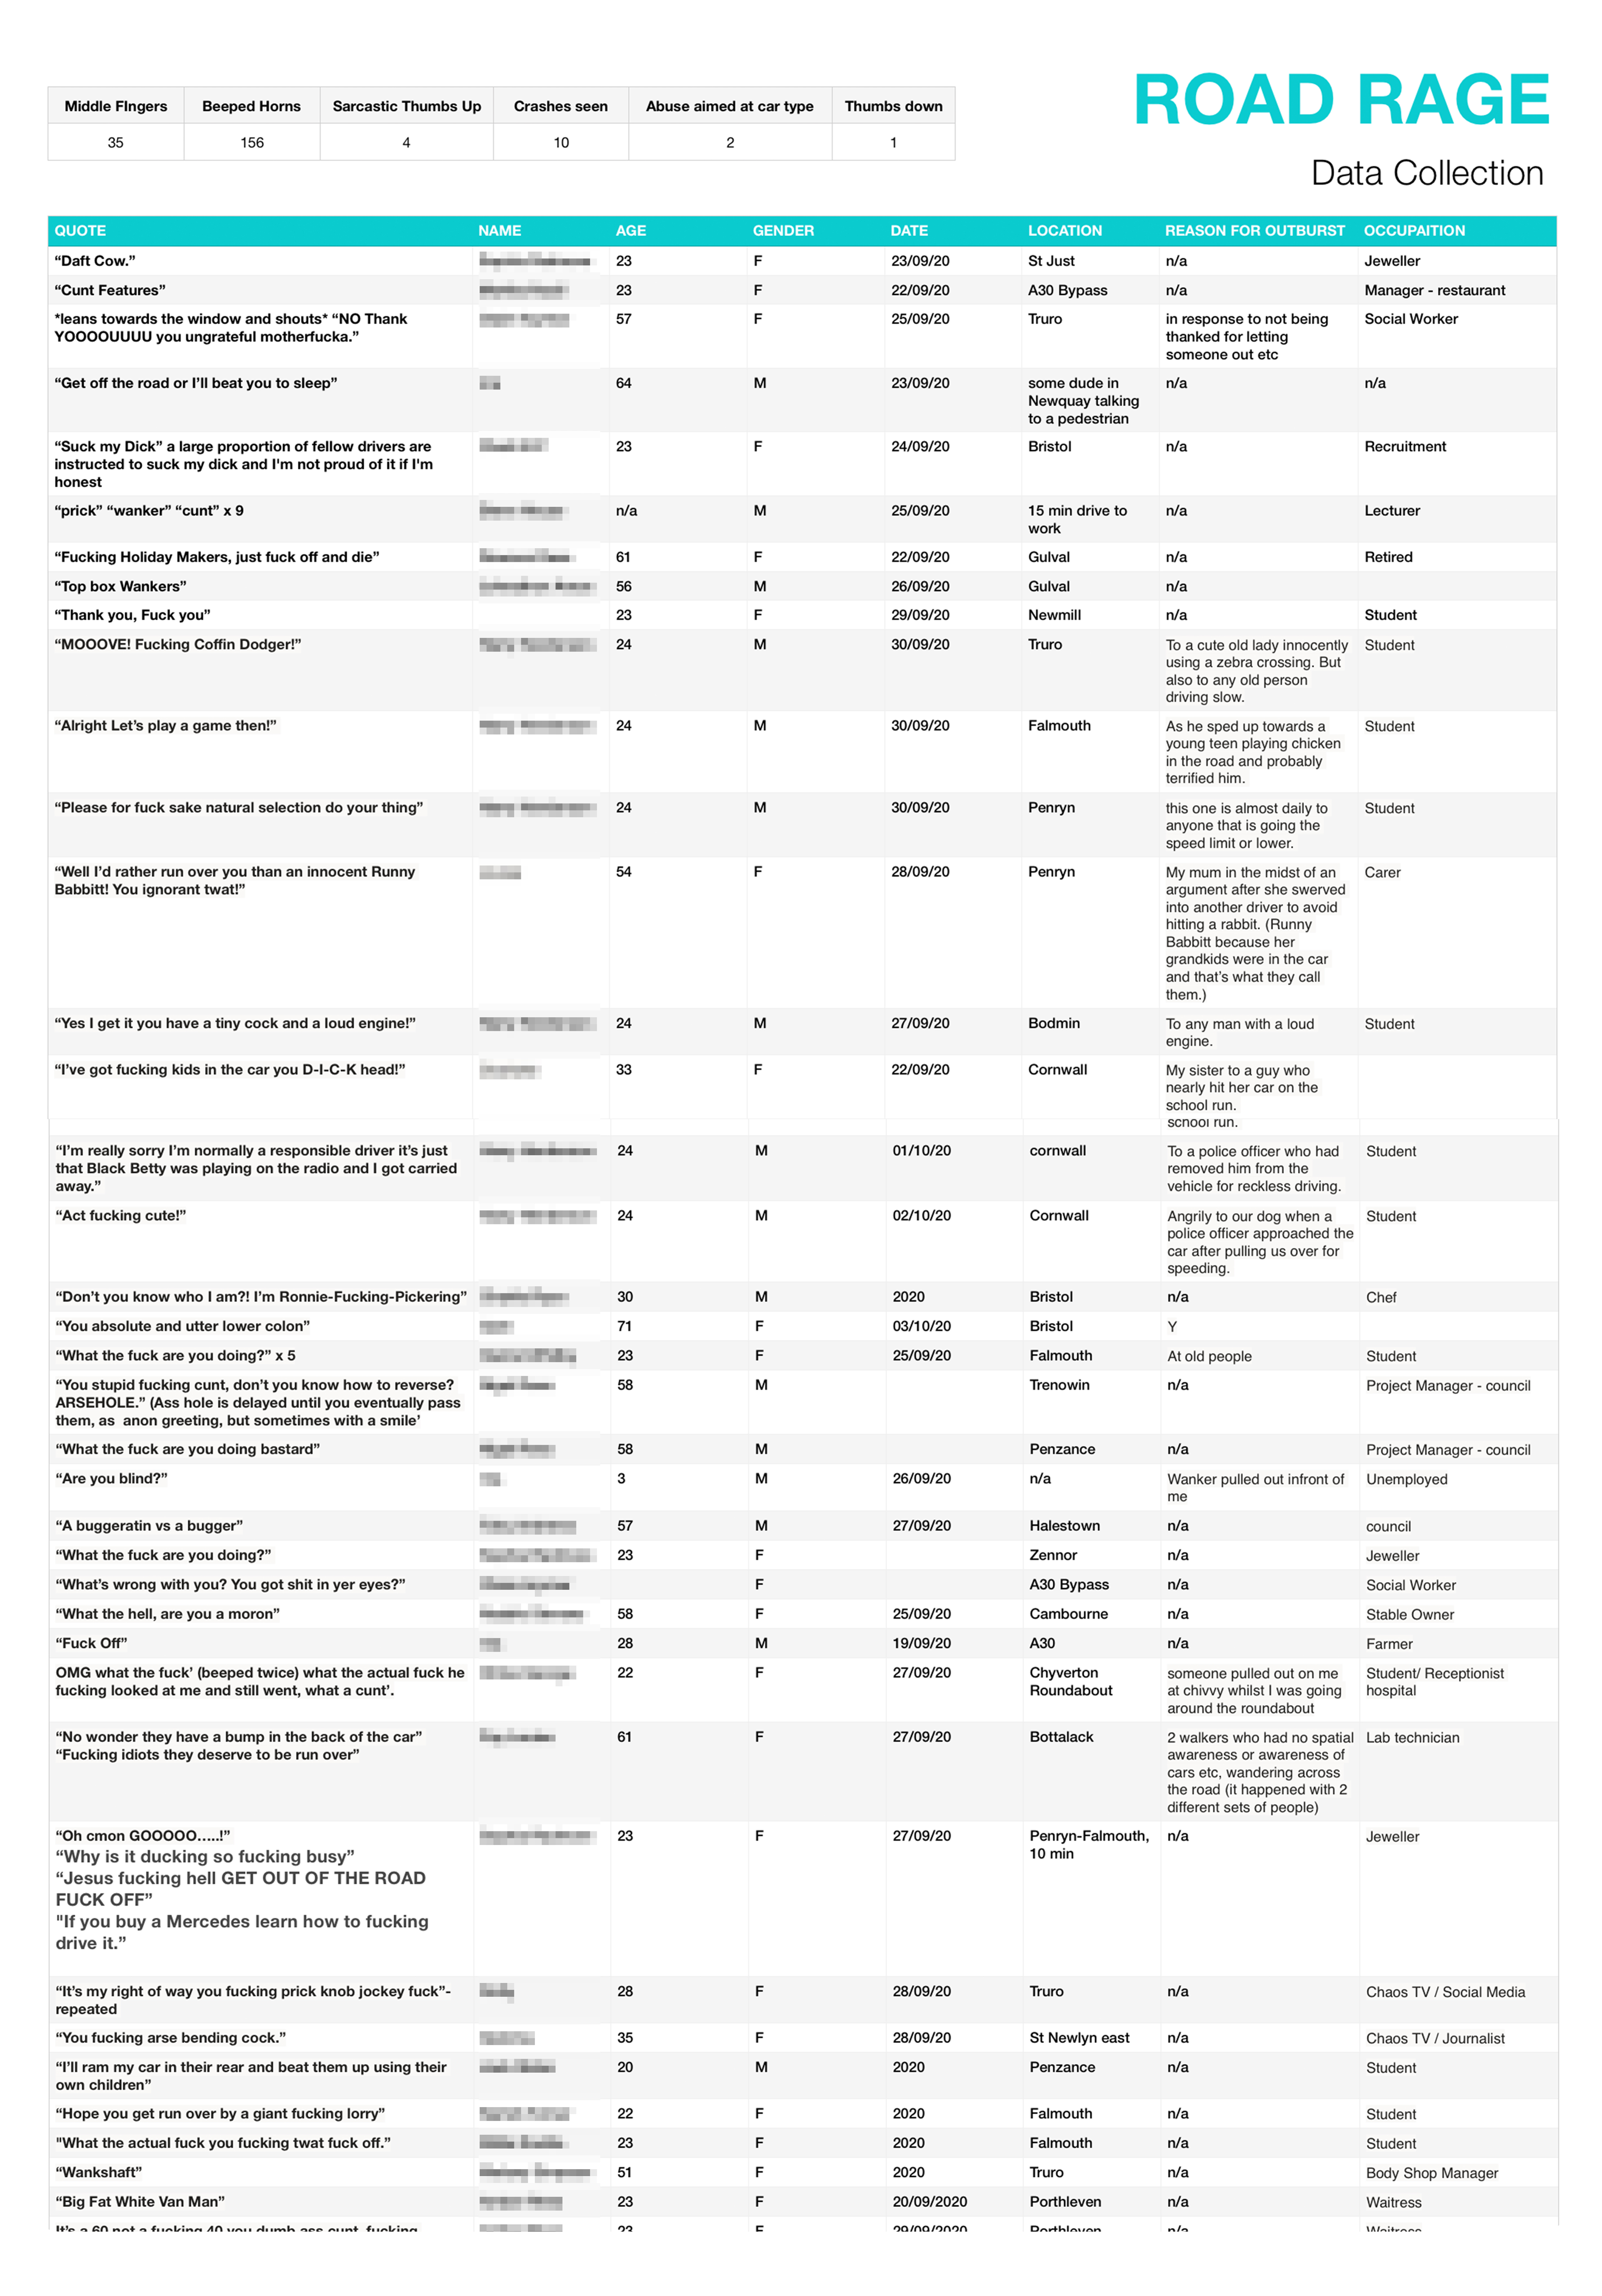
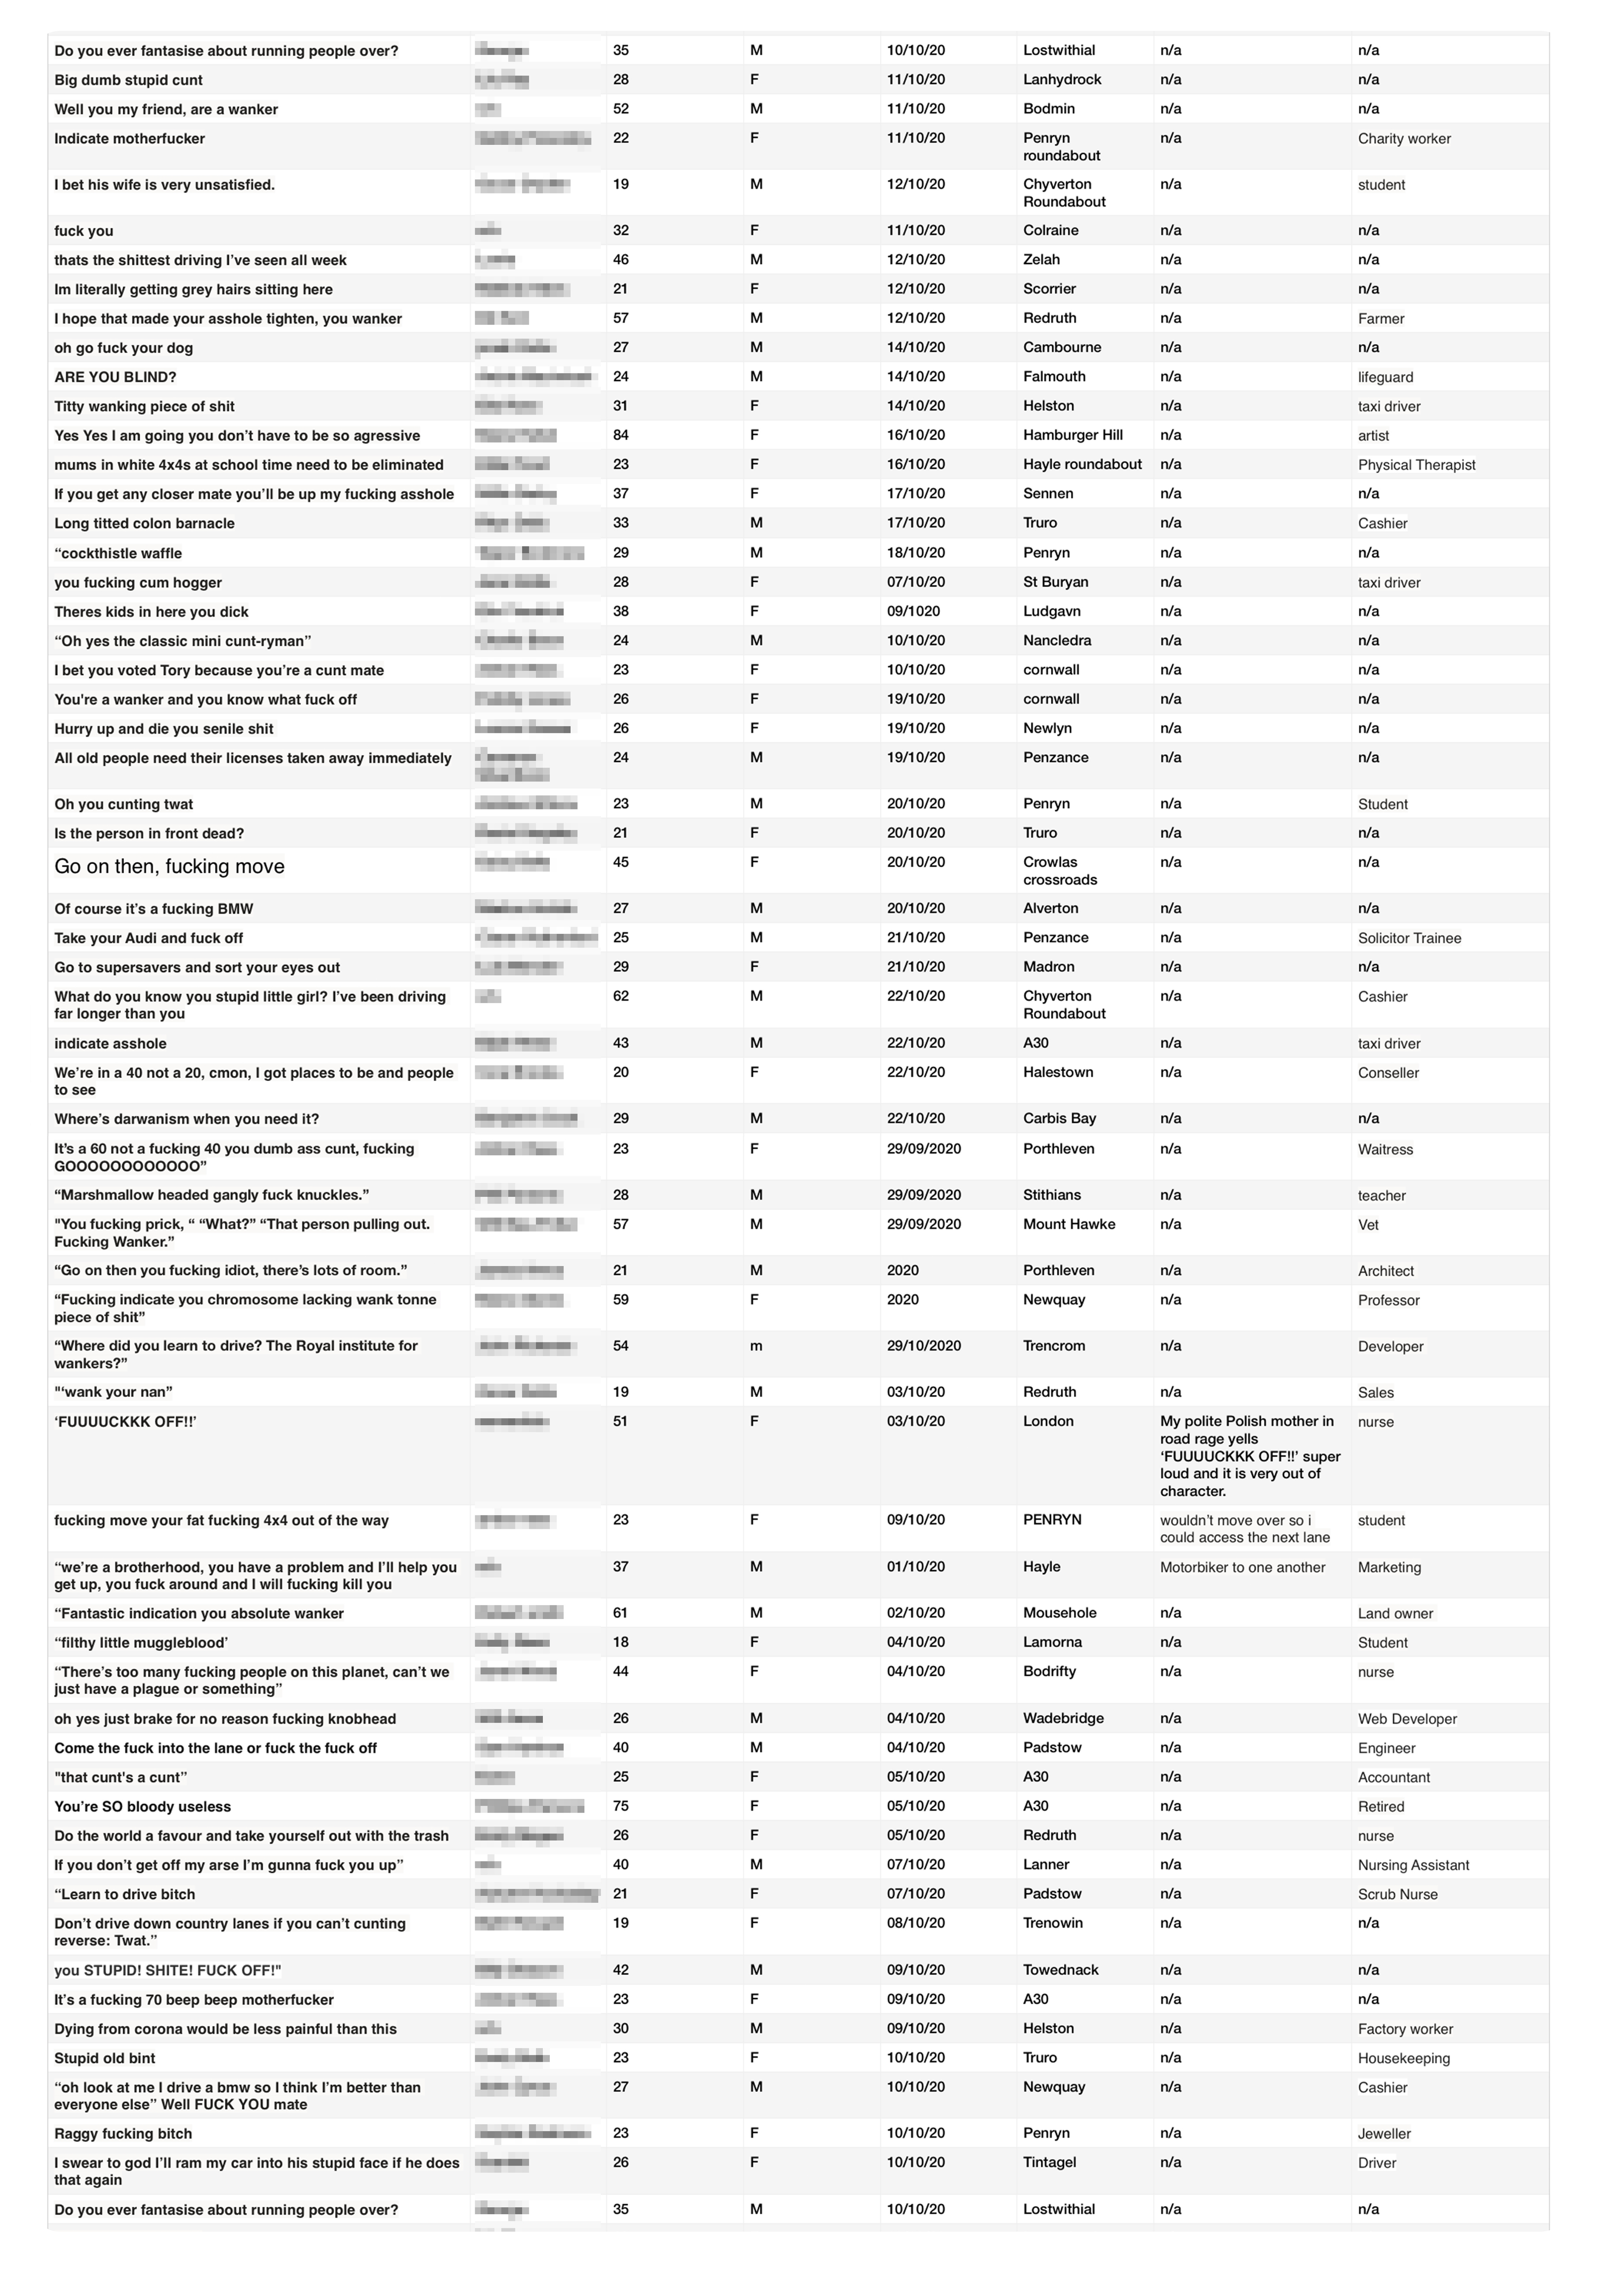
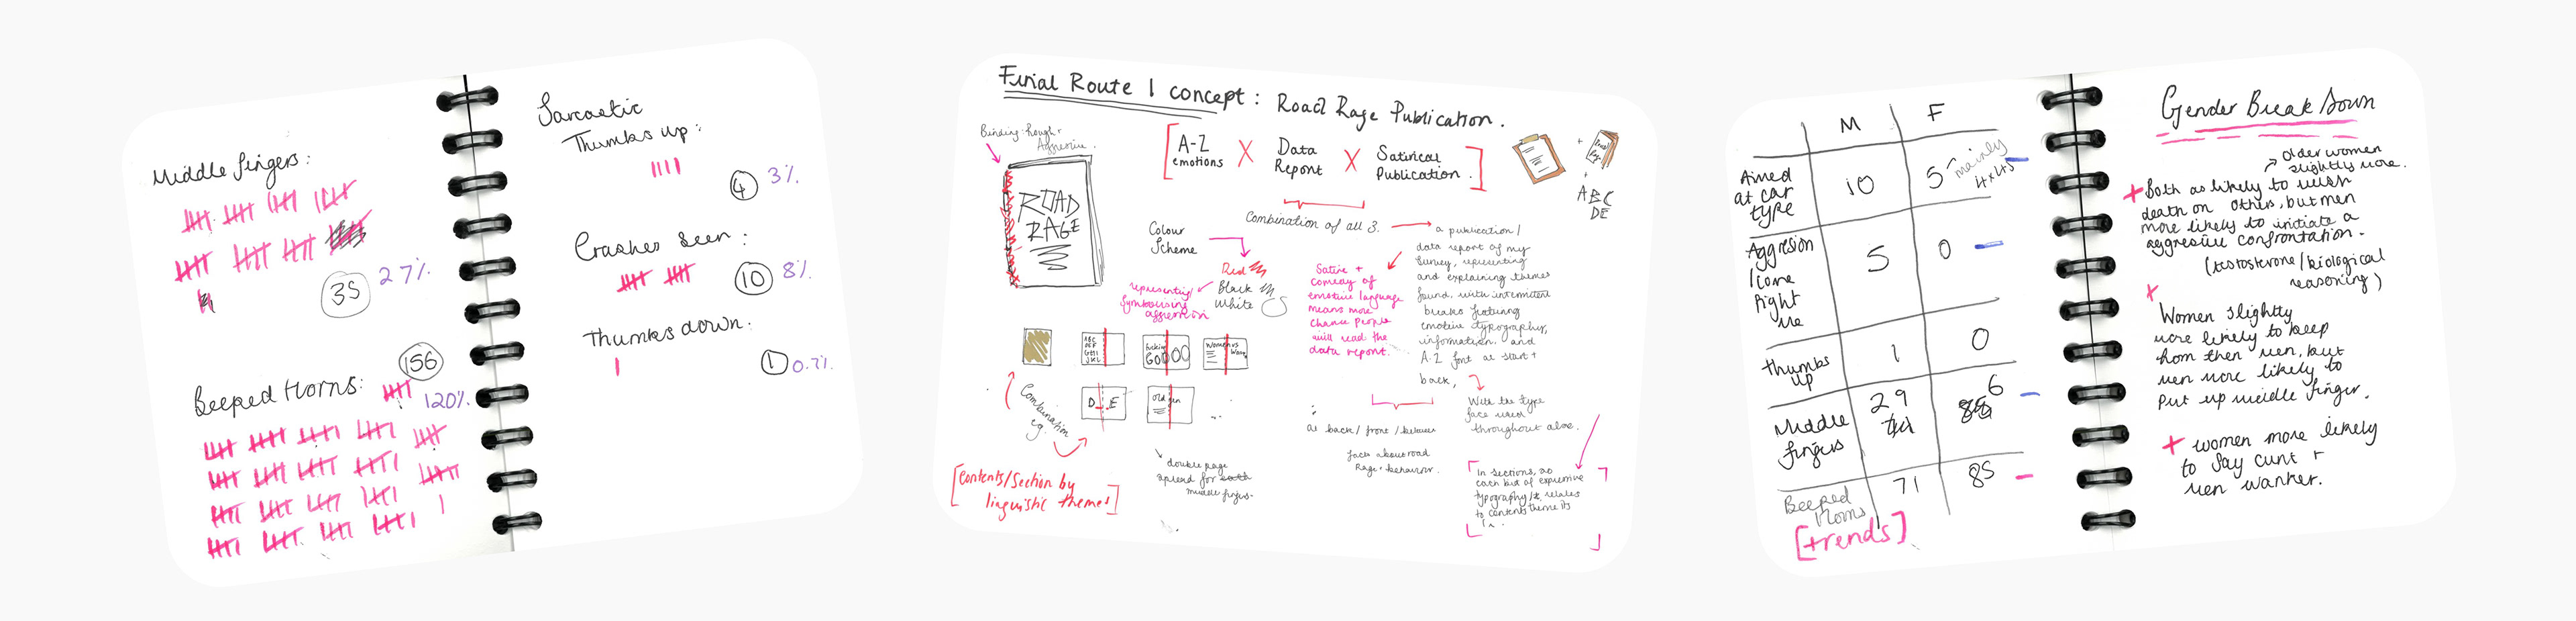
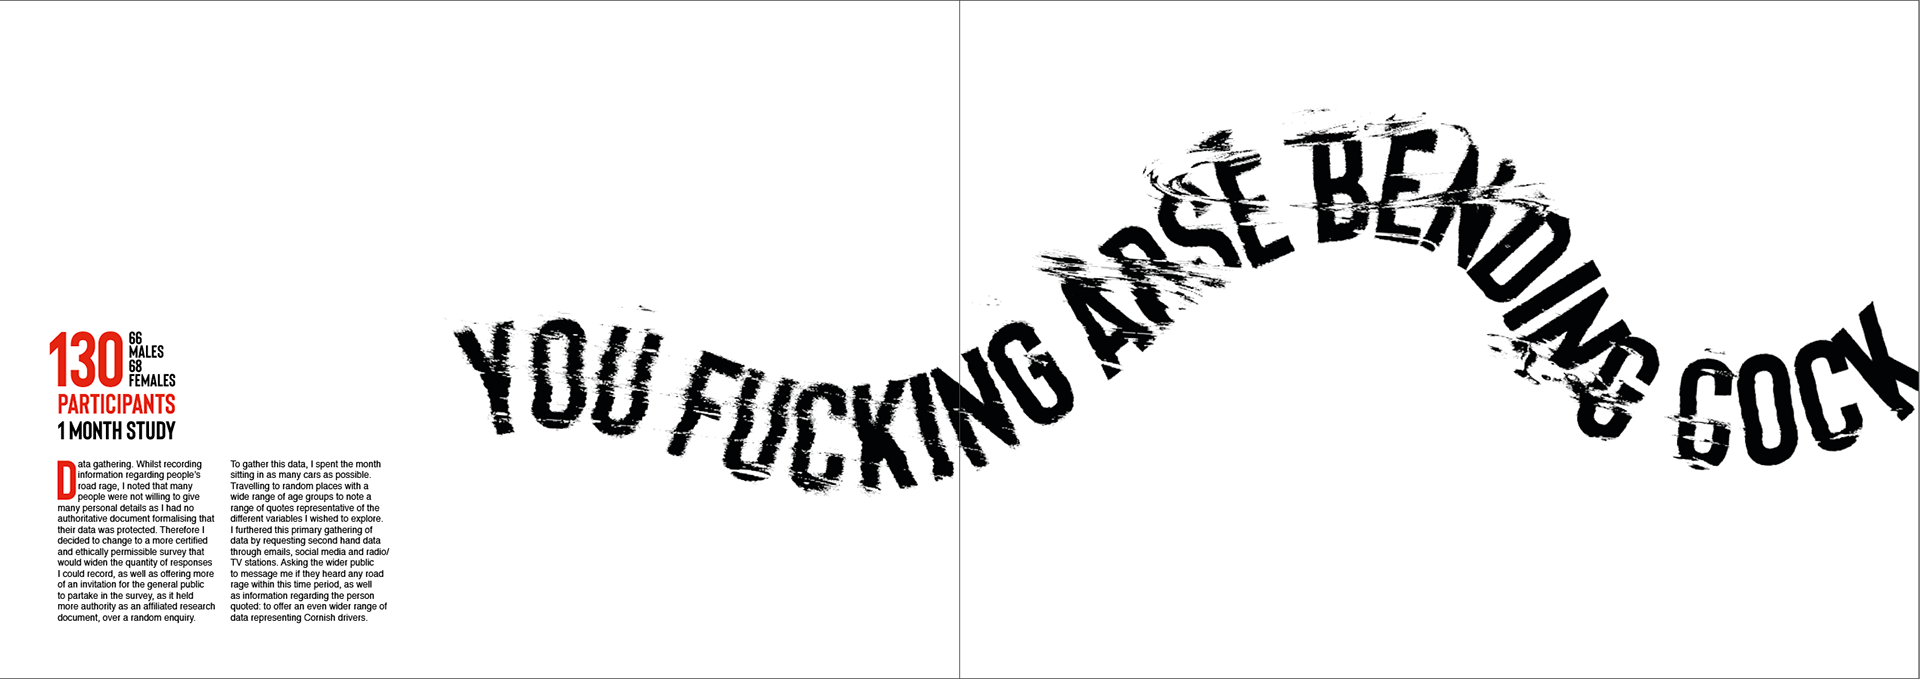
Data Gathering
To answer the question and line of the enquiry proposed I decided to document a range of information around the participants and their quotes. Noting their age, gender and occupation, as well as the date, location and reason for the incident. Hoping that through this combination of data some trends may become clear that could be used as the beginning point for a series of projects. To gather this data, I spent the month sitting in as many cars as possible. Travelling to random places with a wide range of age groups to note a range of quotes representative of the different variables I wished to explore. I furthered this primary gathering of data by requesting second hand data through emails and social media. Asking people to message me if they heard any road rage within this time period, as well as information regarding the person quoted. Furthermore I have a contact who works at Chaos radio station, who also asked people on air to text in any road rage they heard or experienced: to offer an even wider range of data within Cornish drivers.
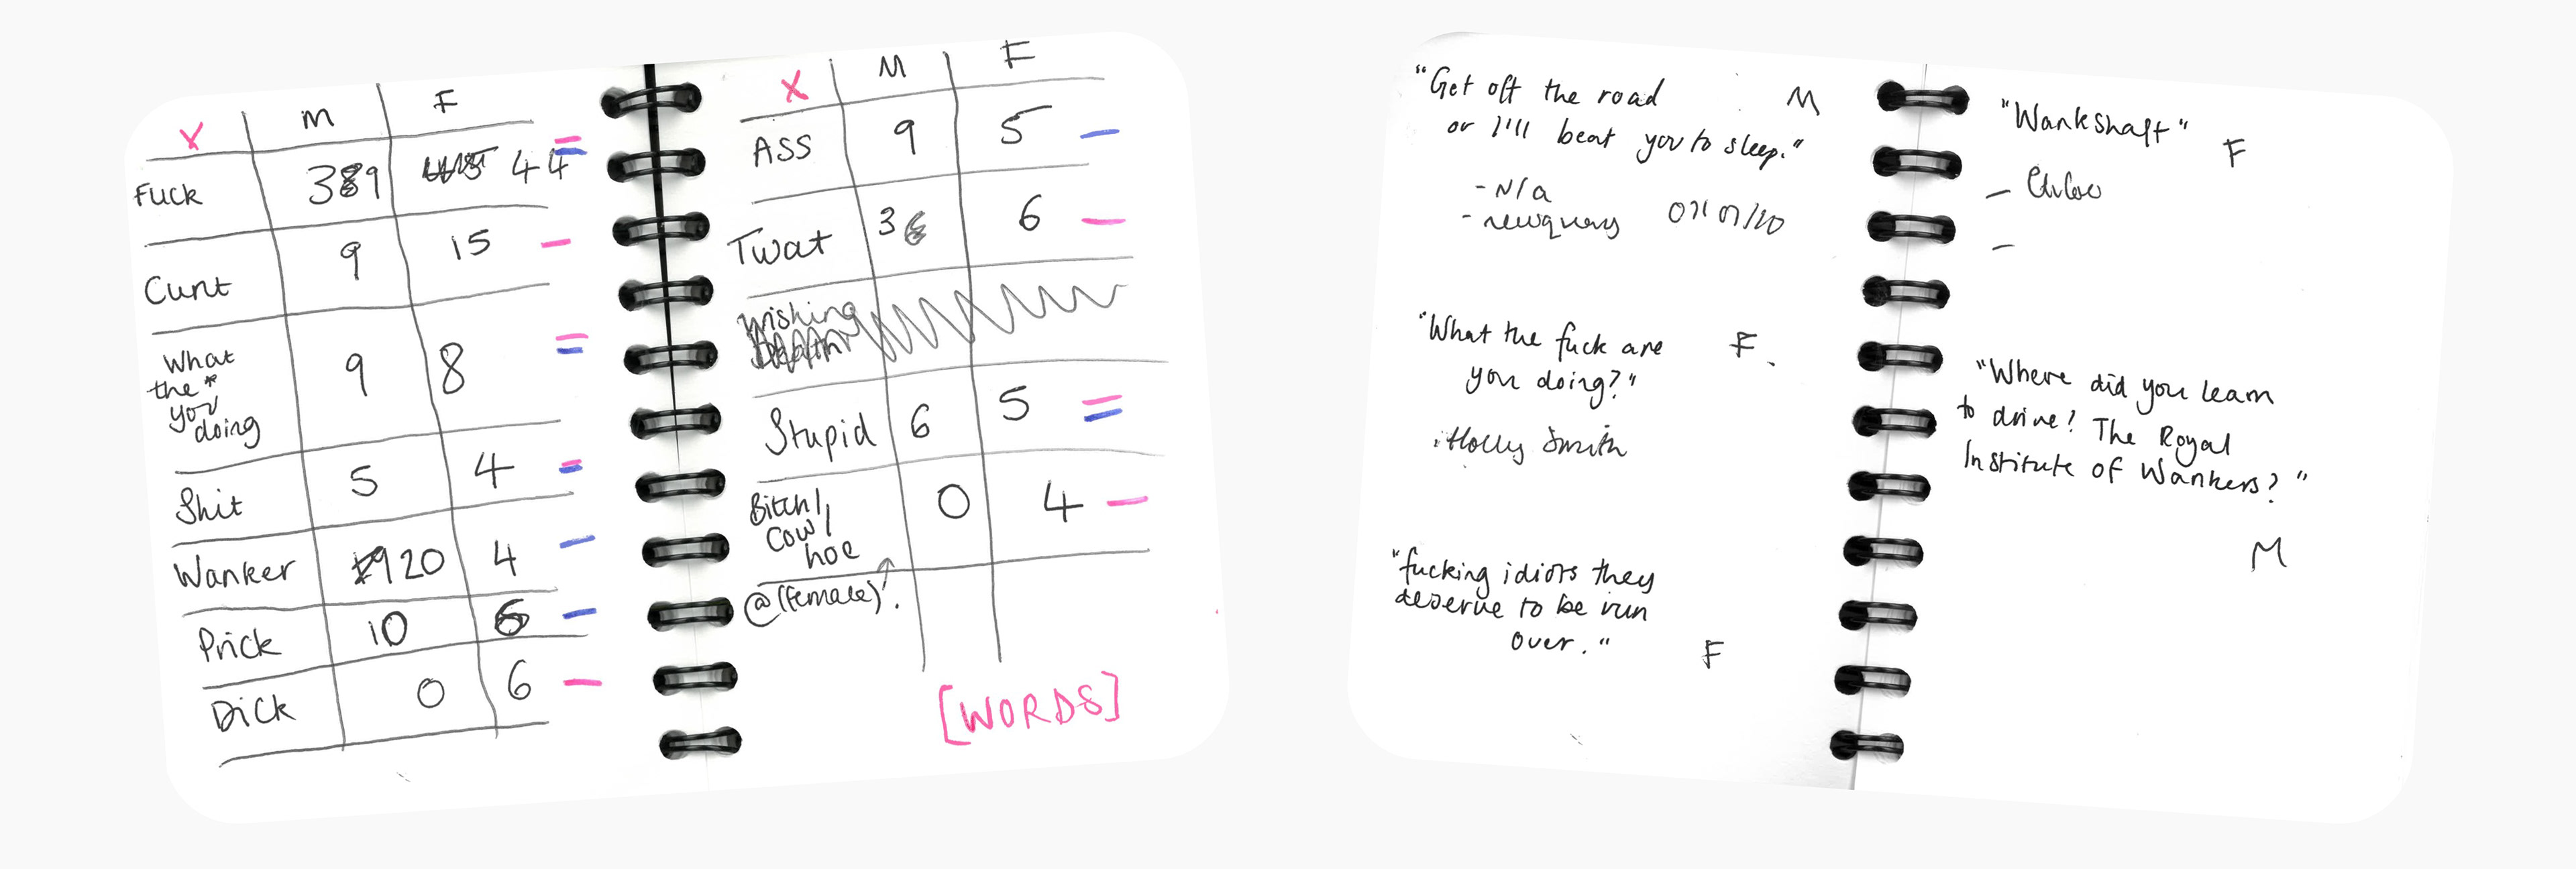
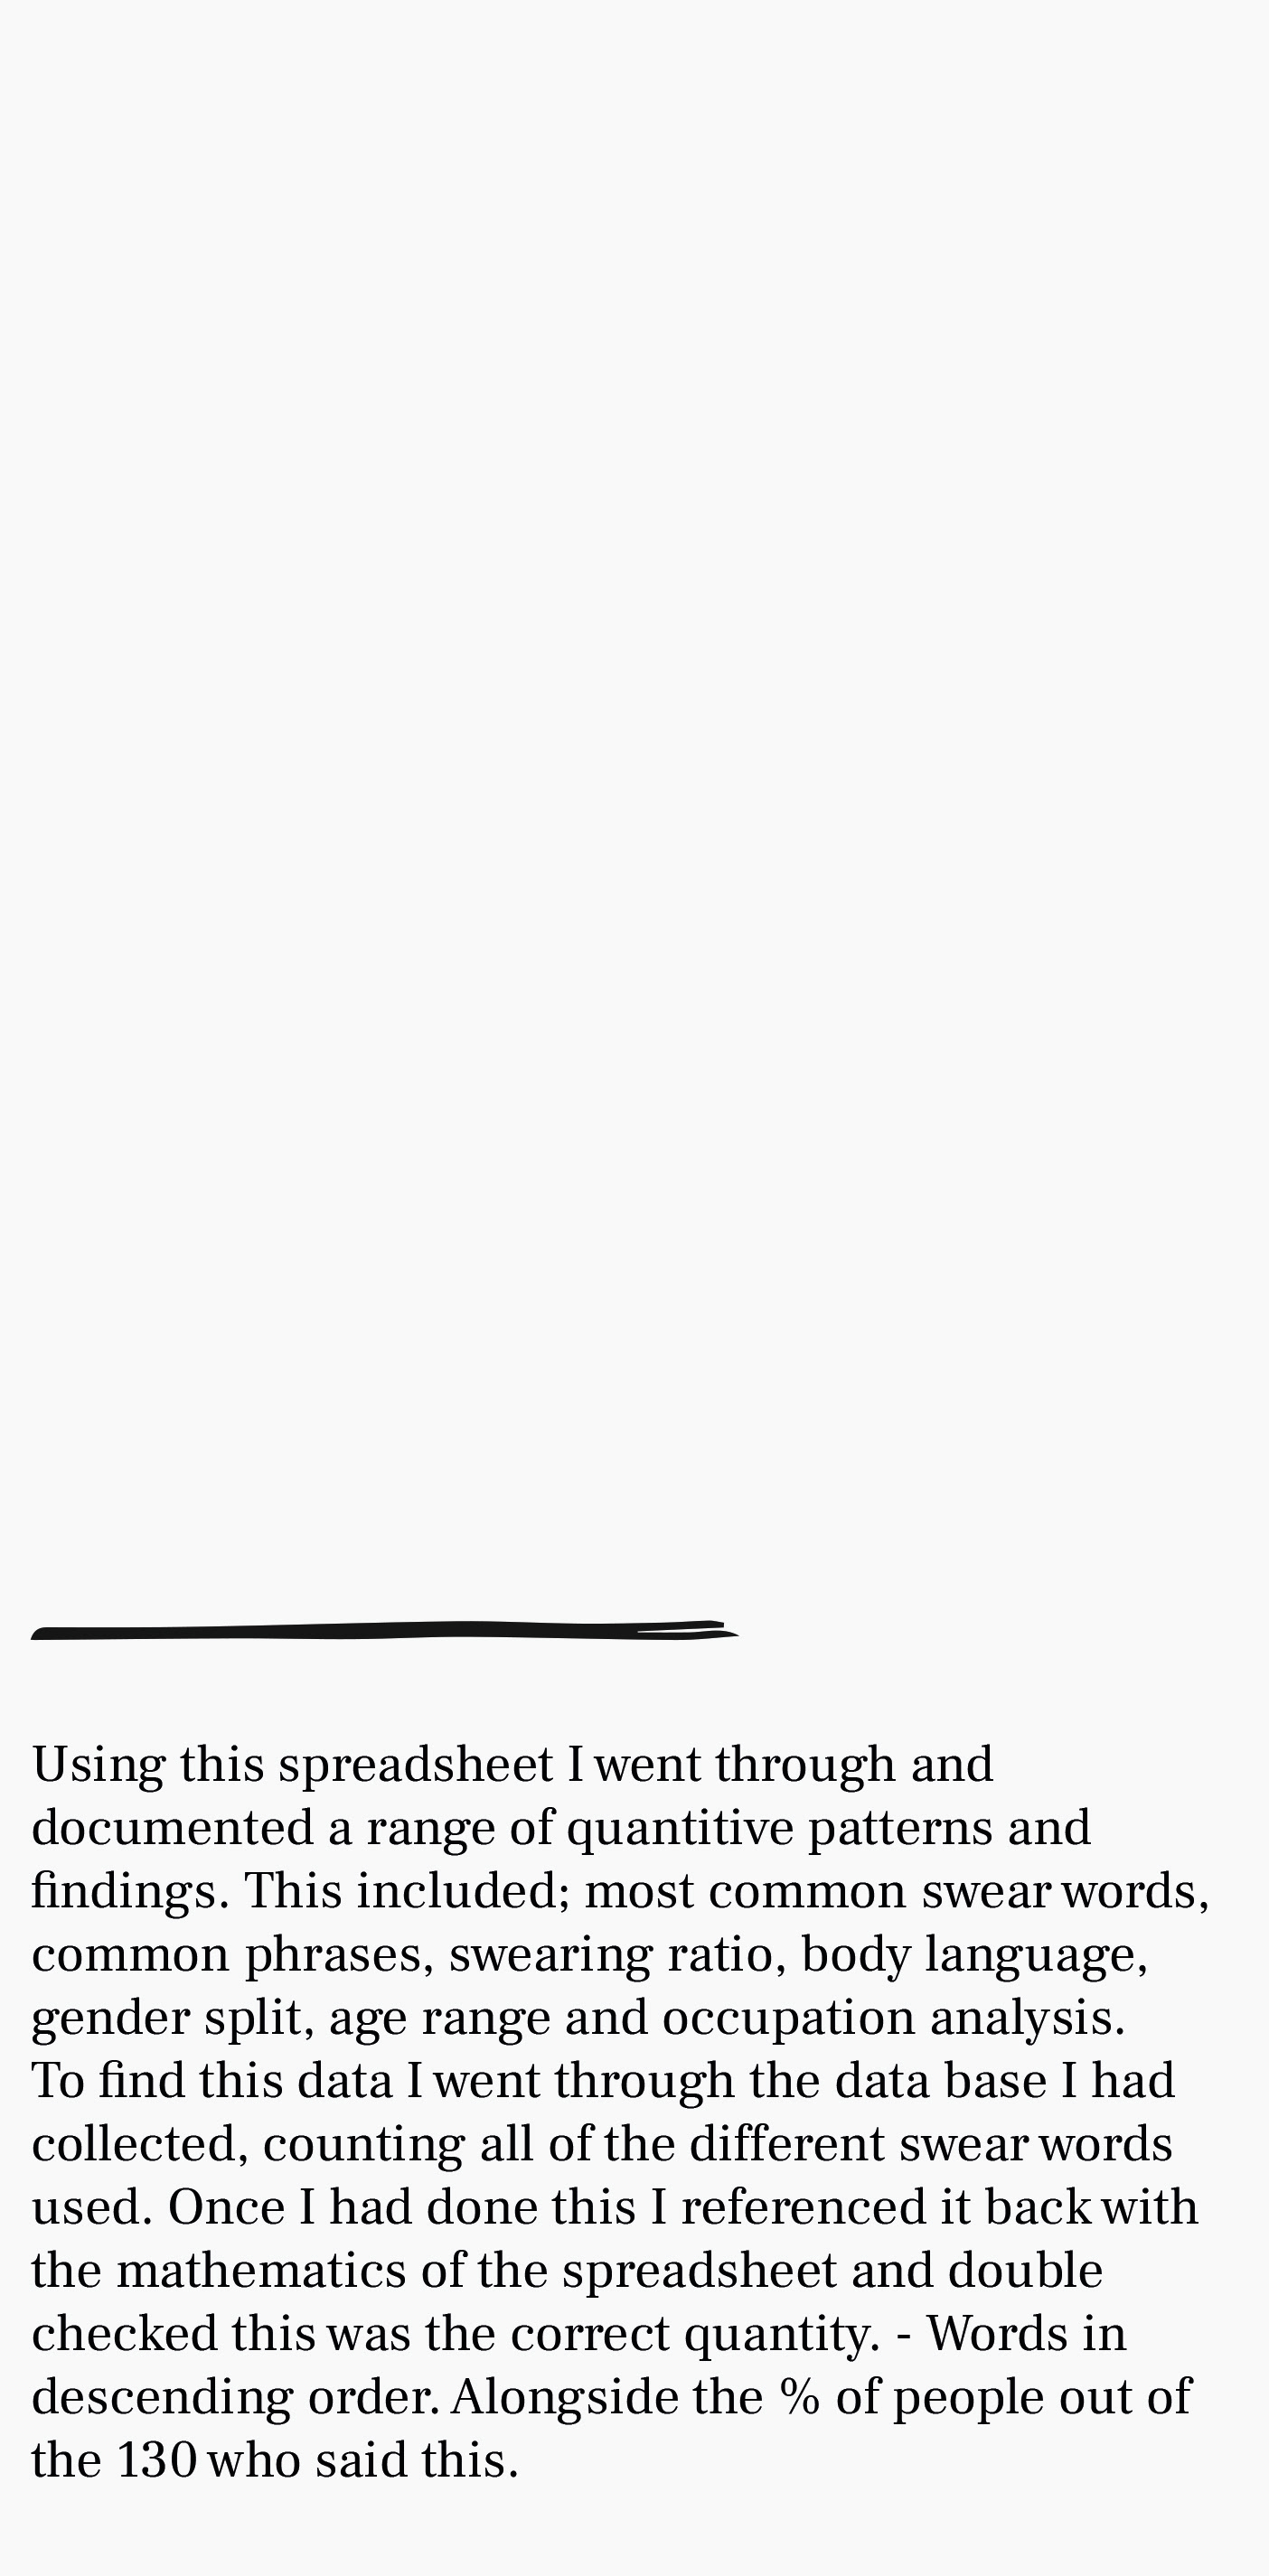
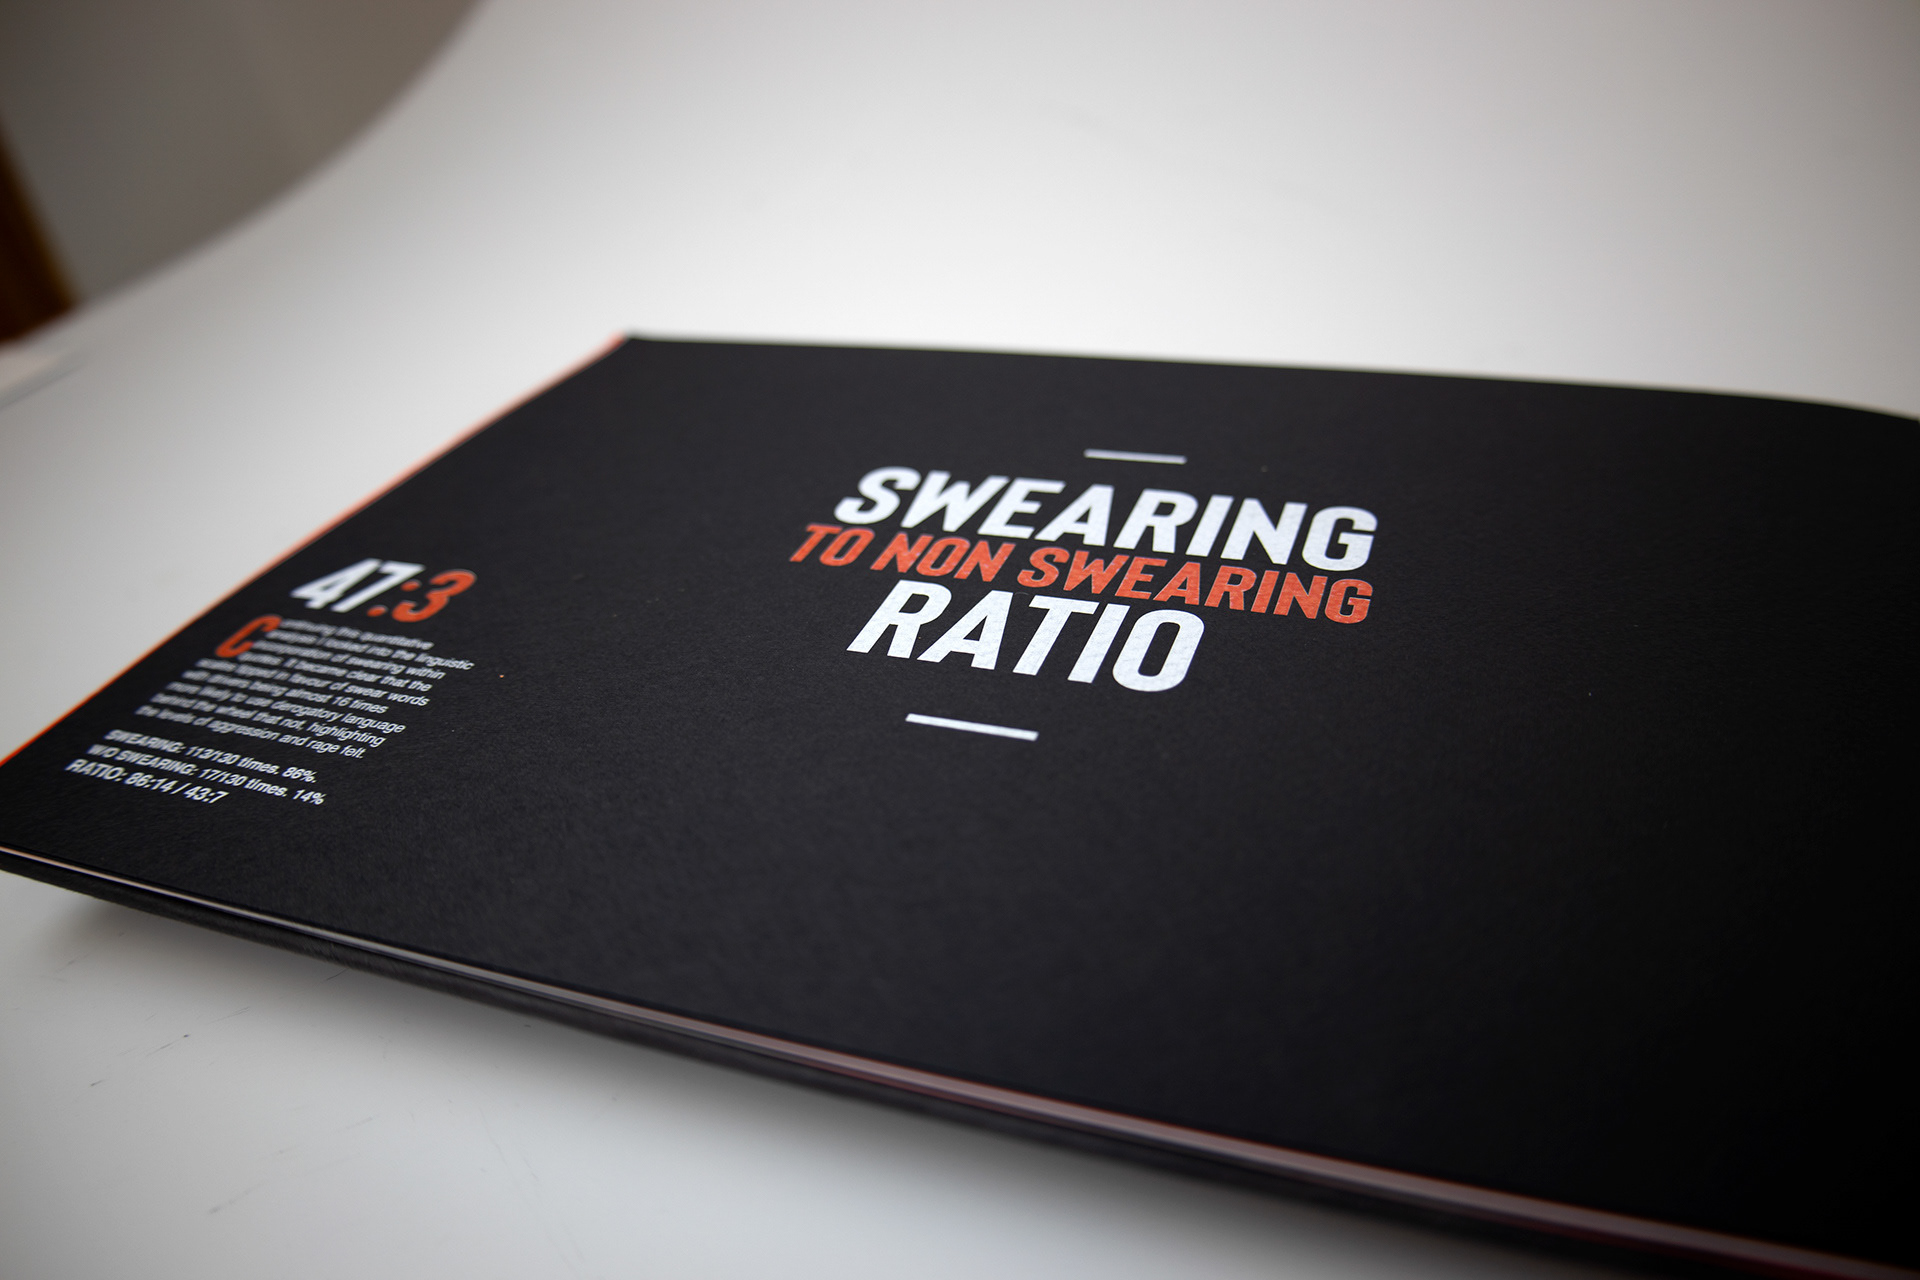
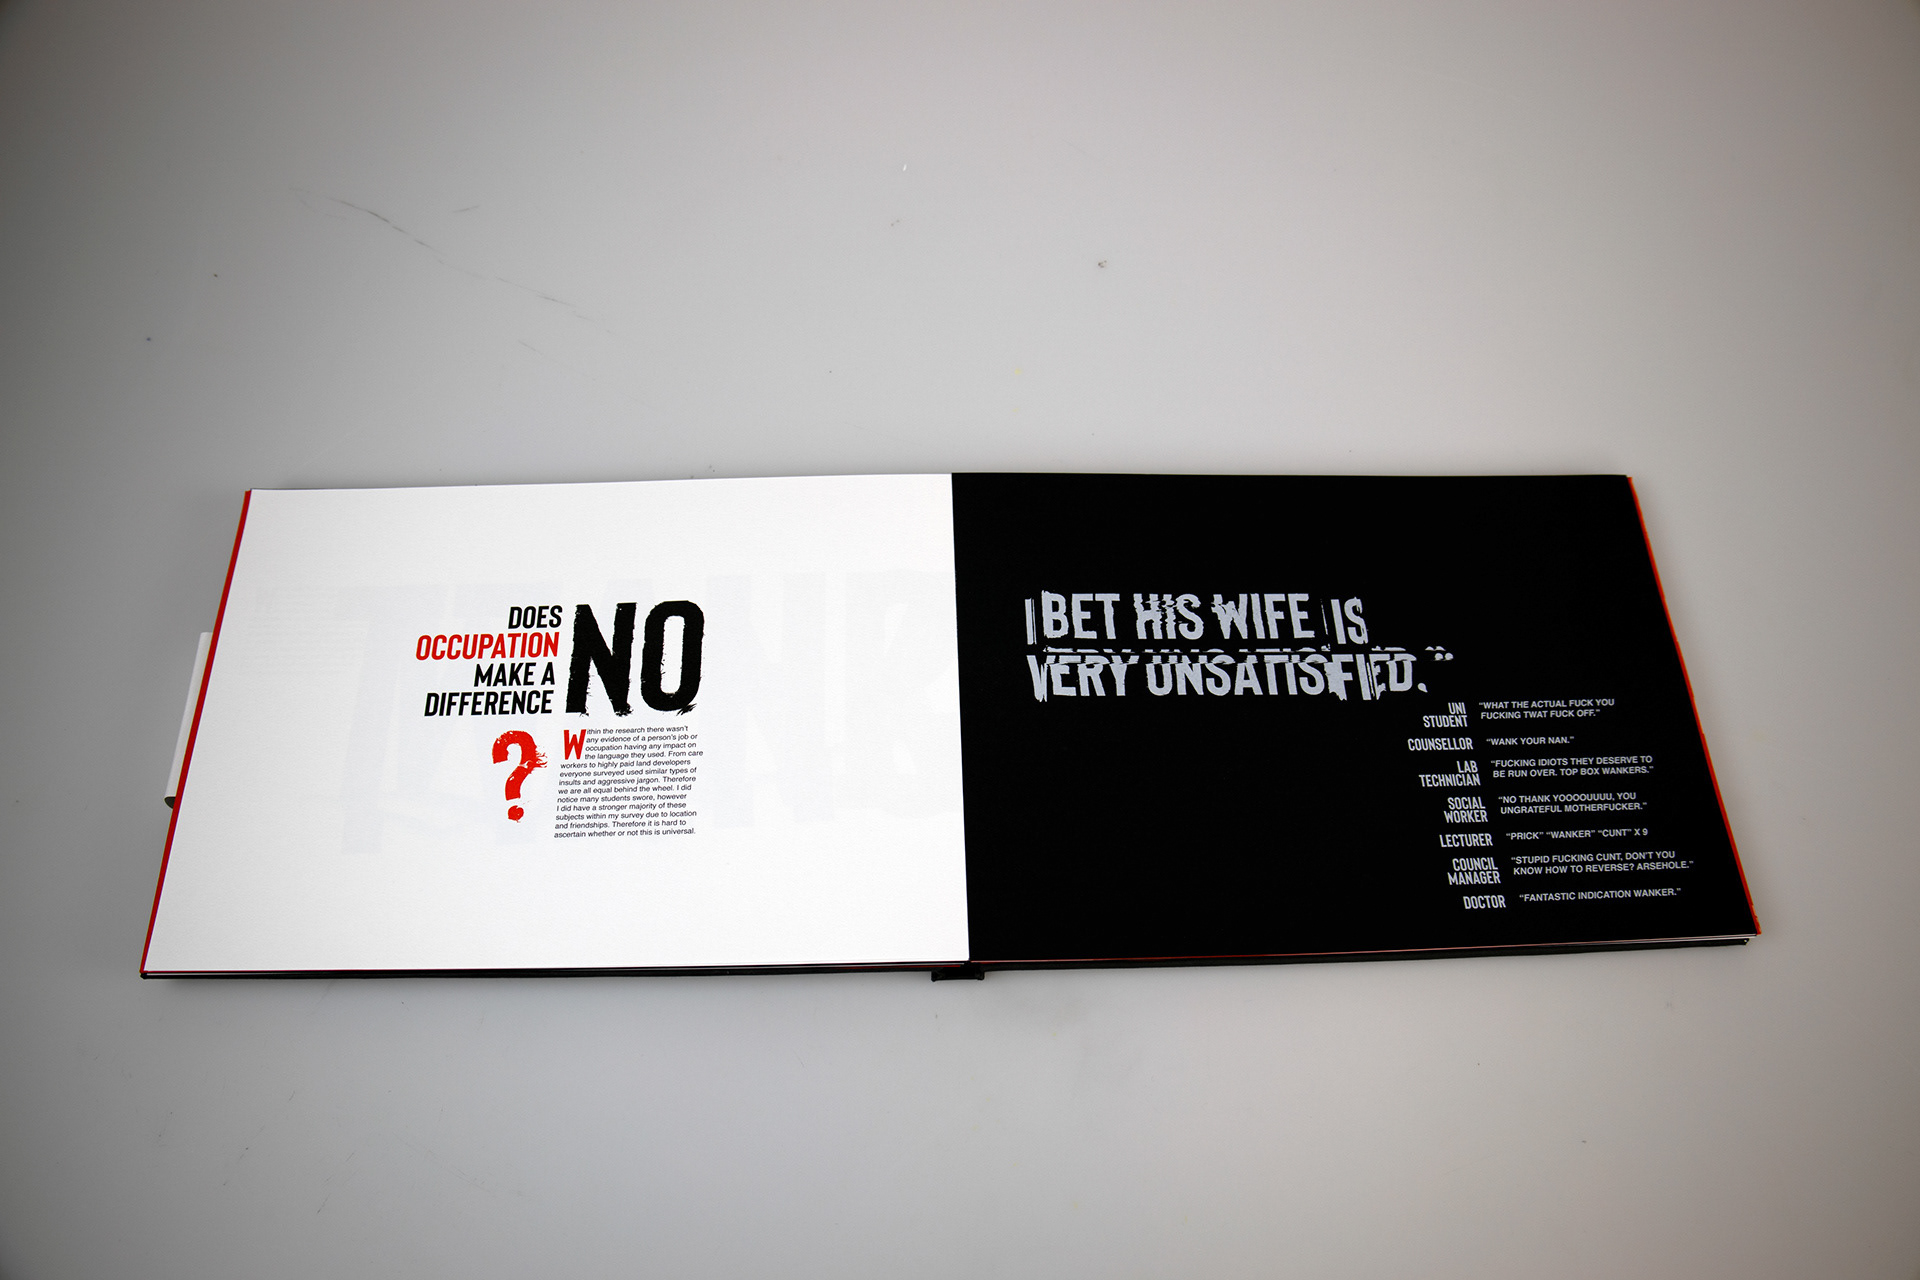
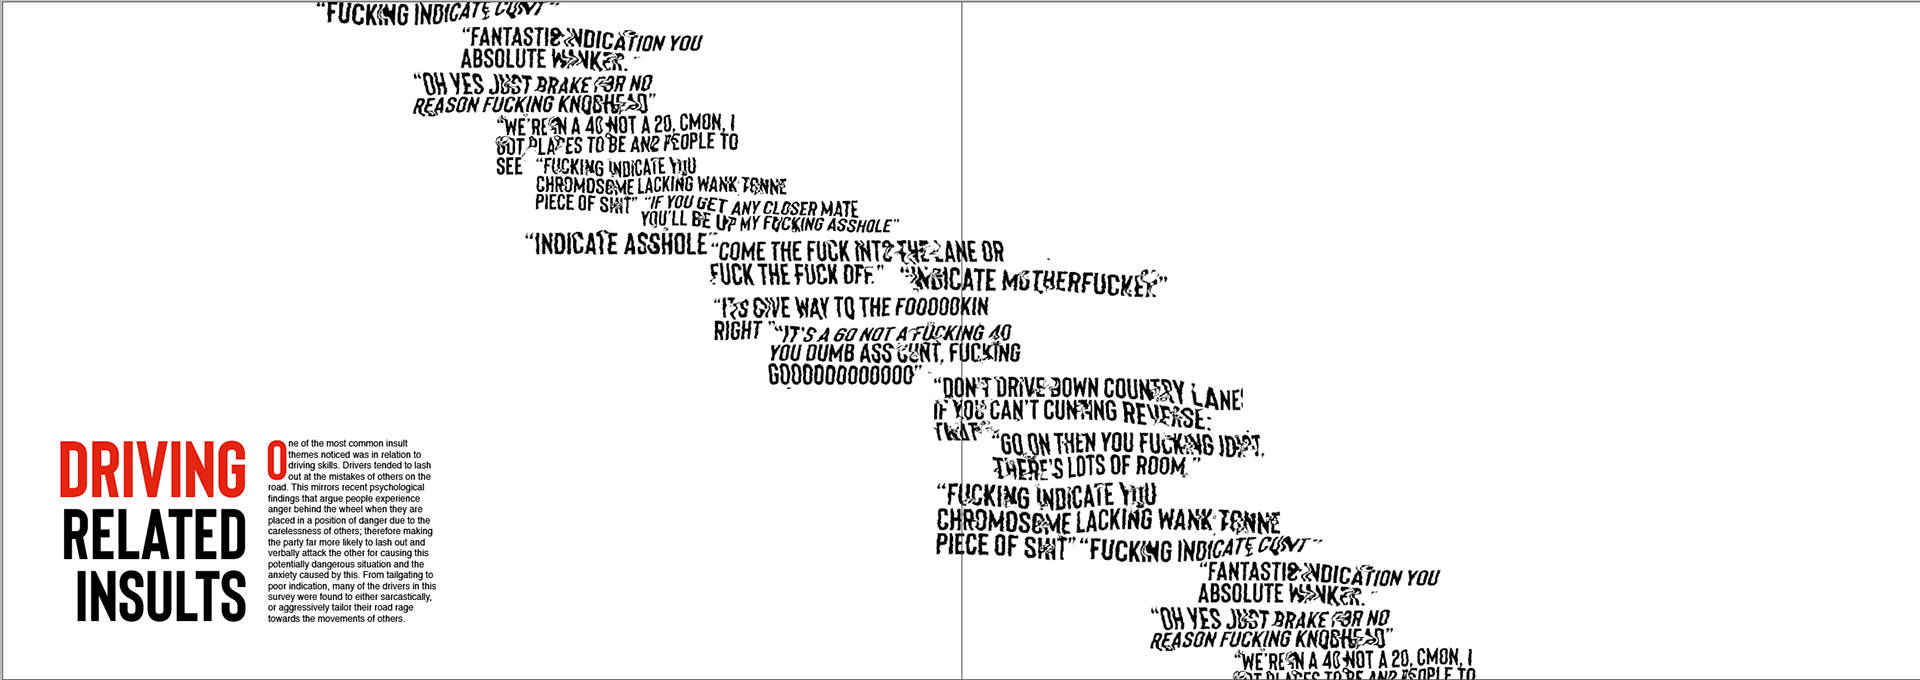
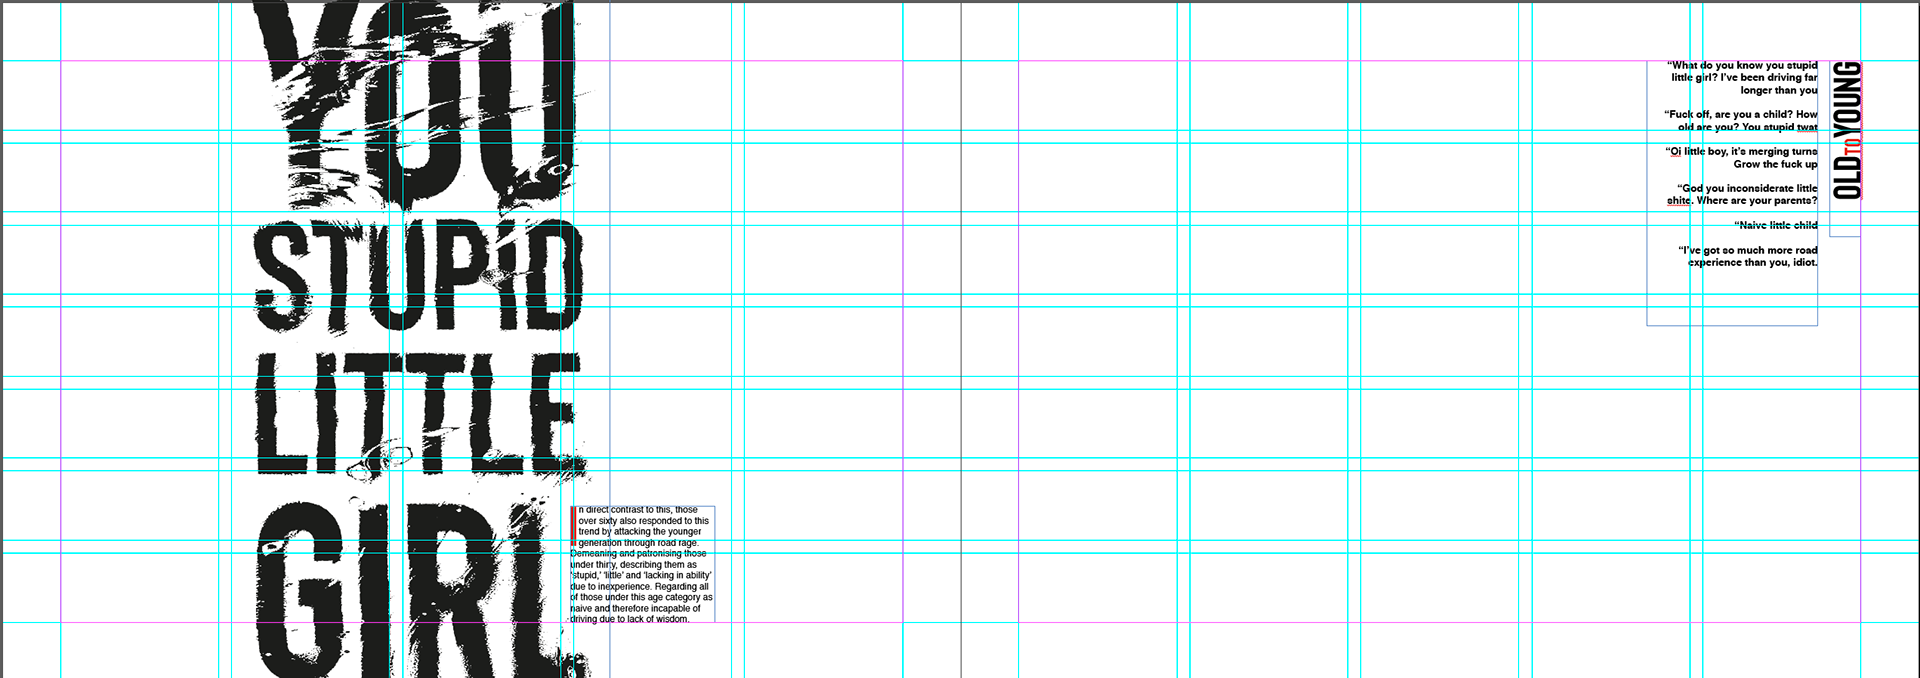
Analysis
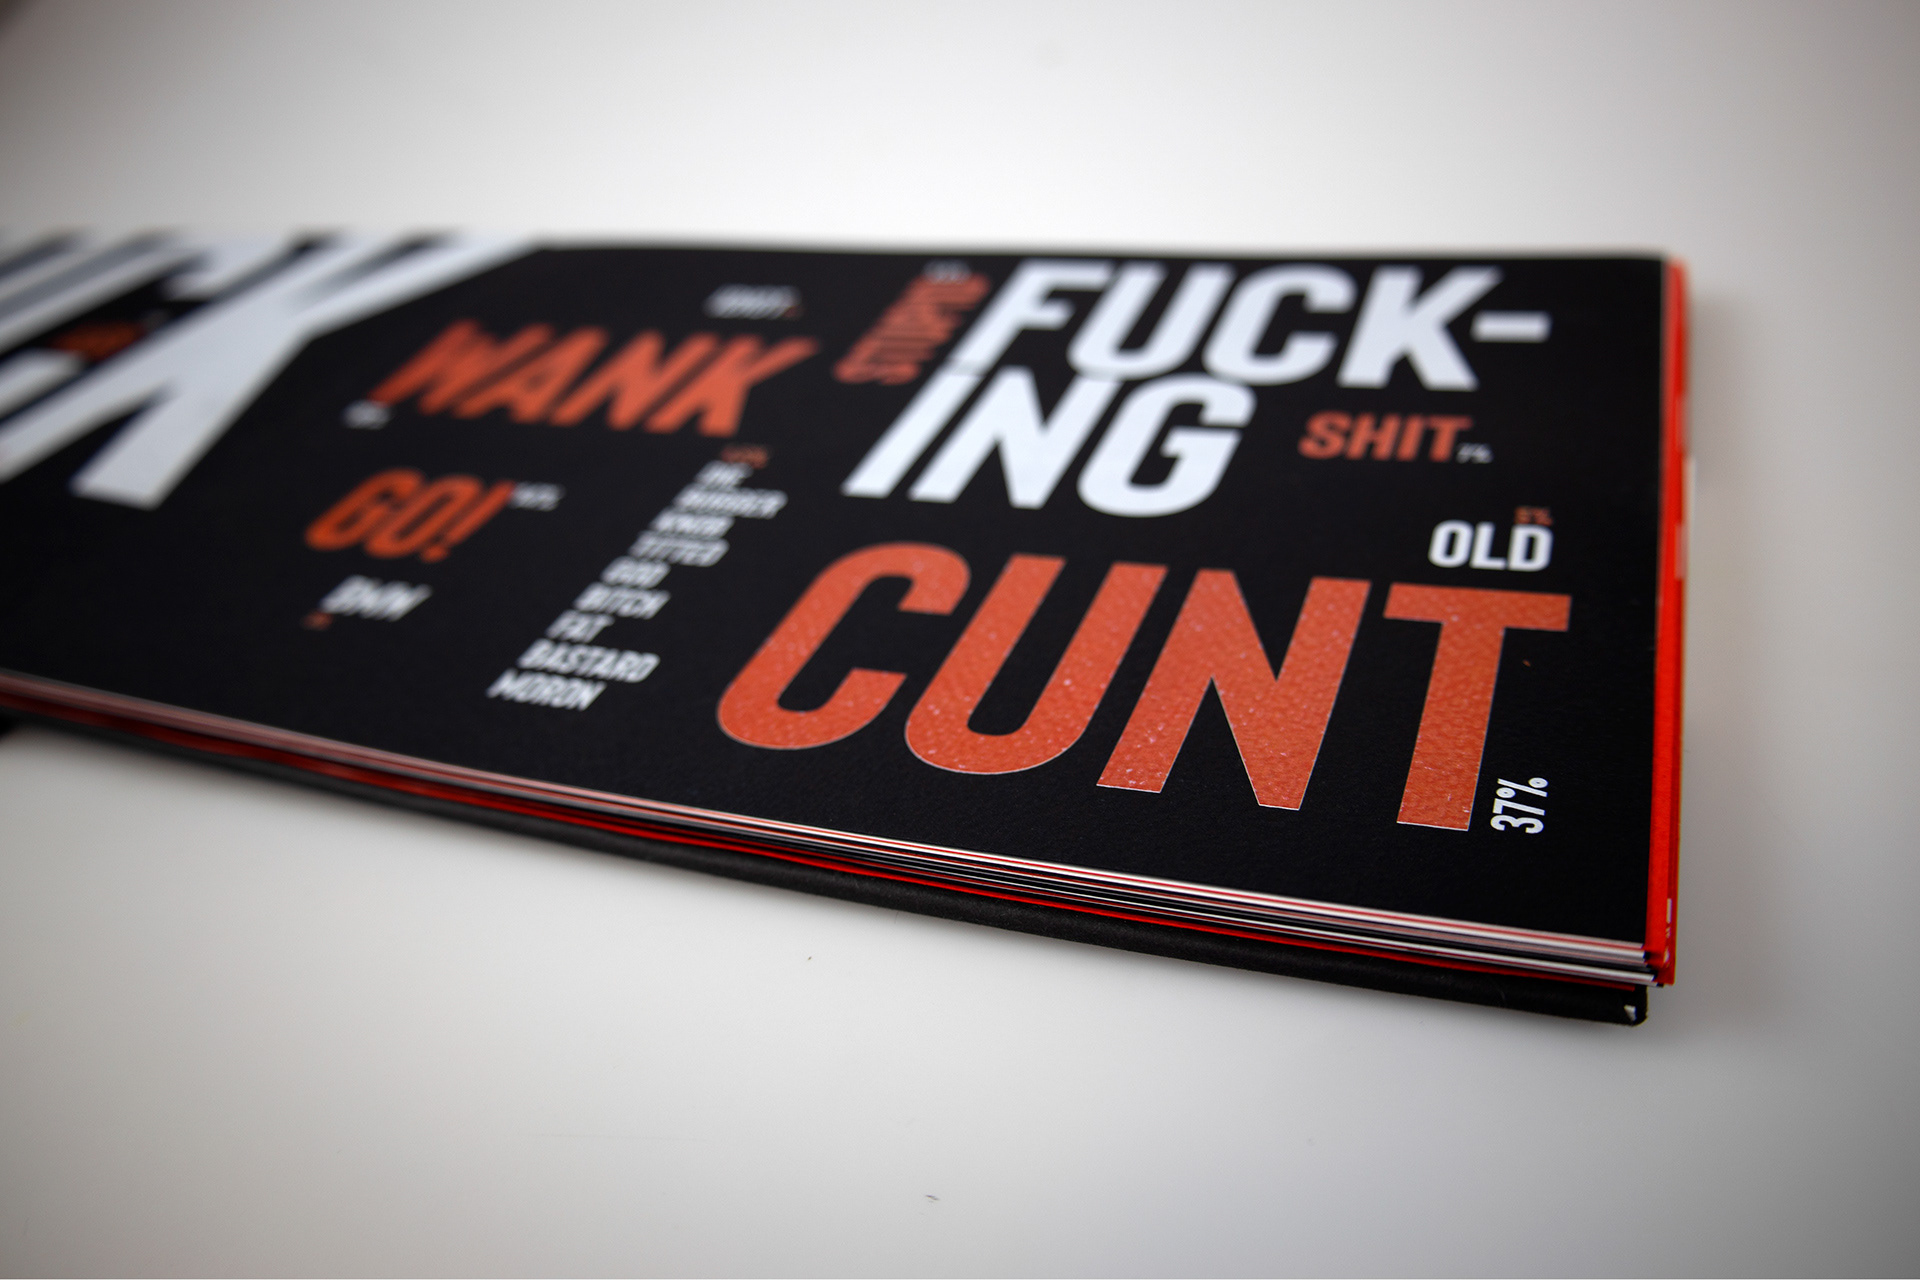
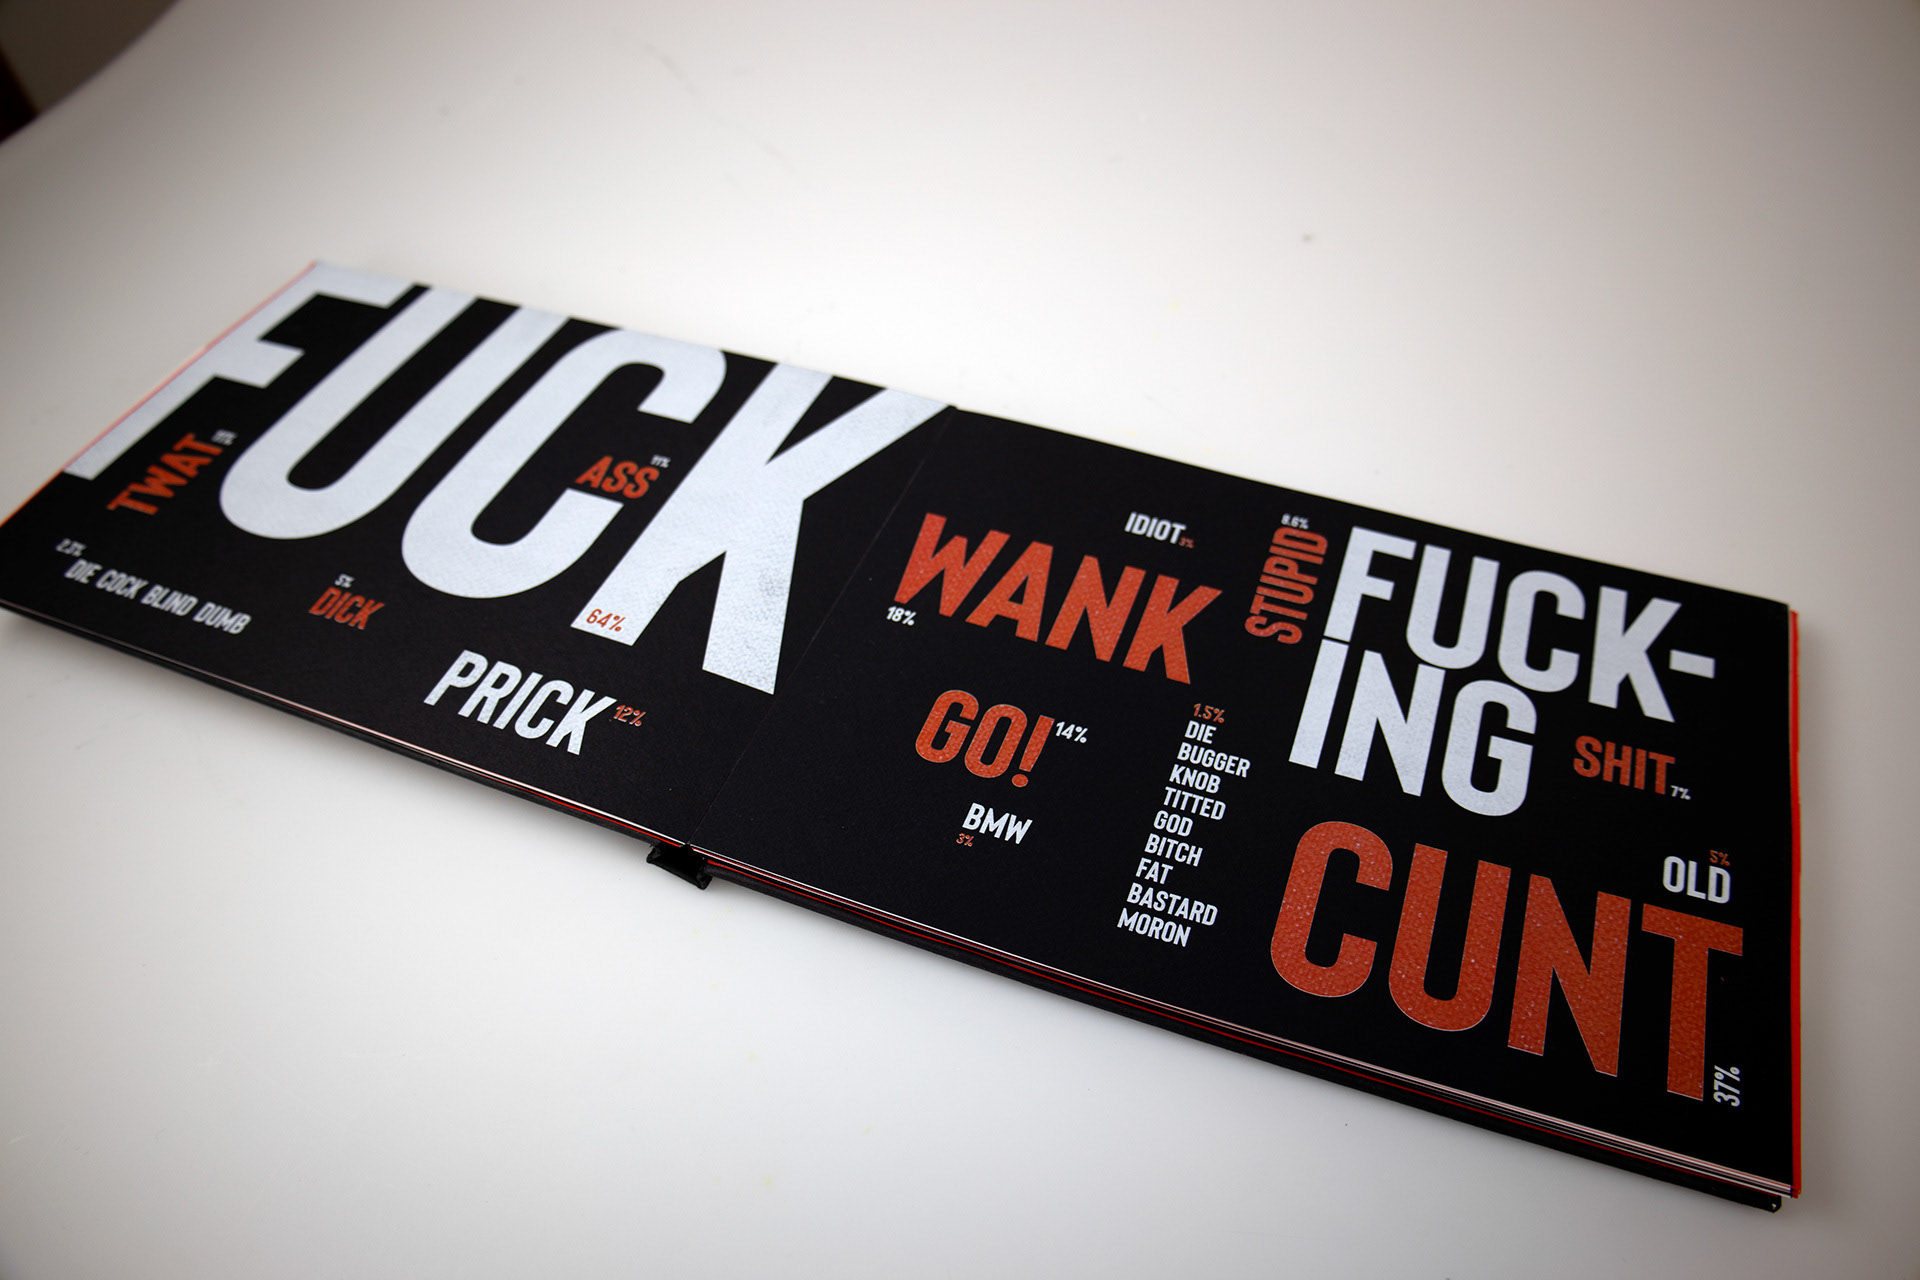
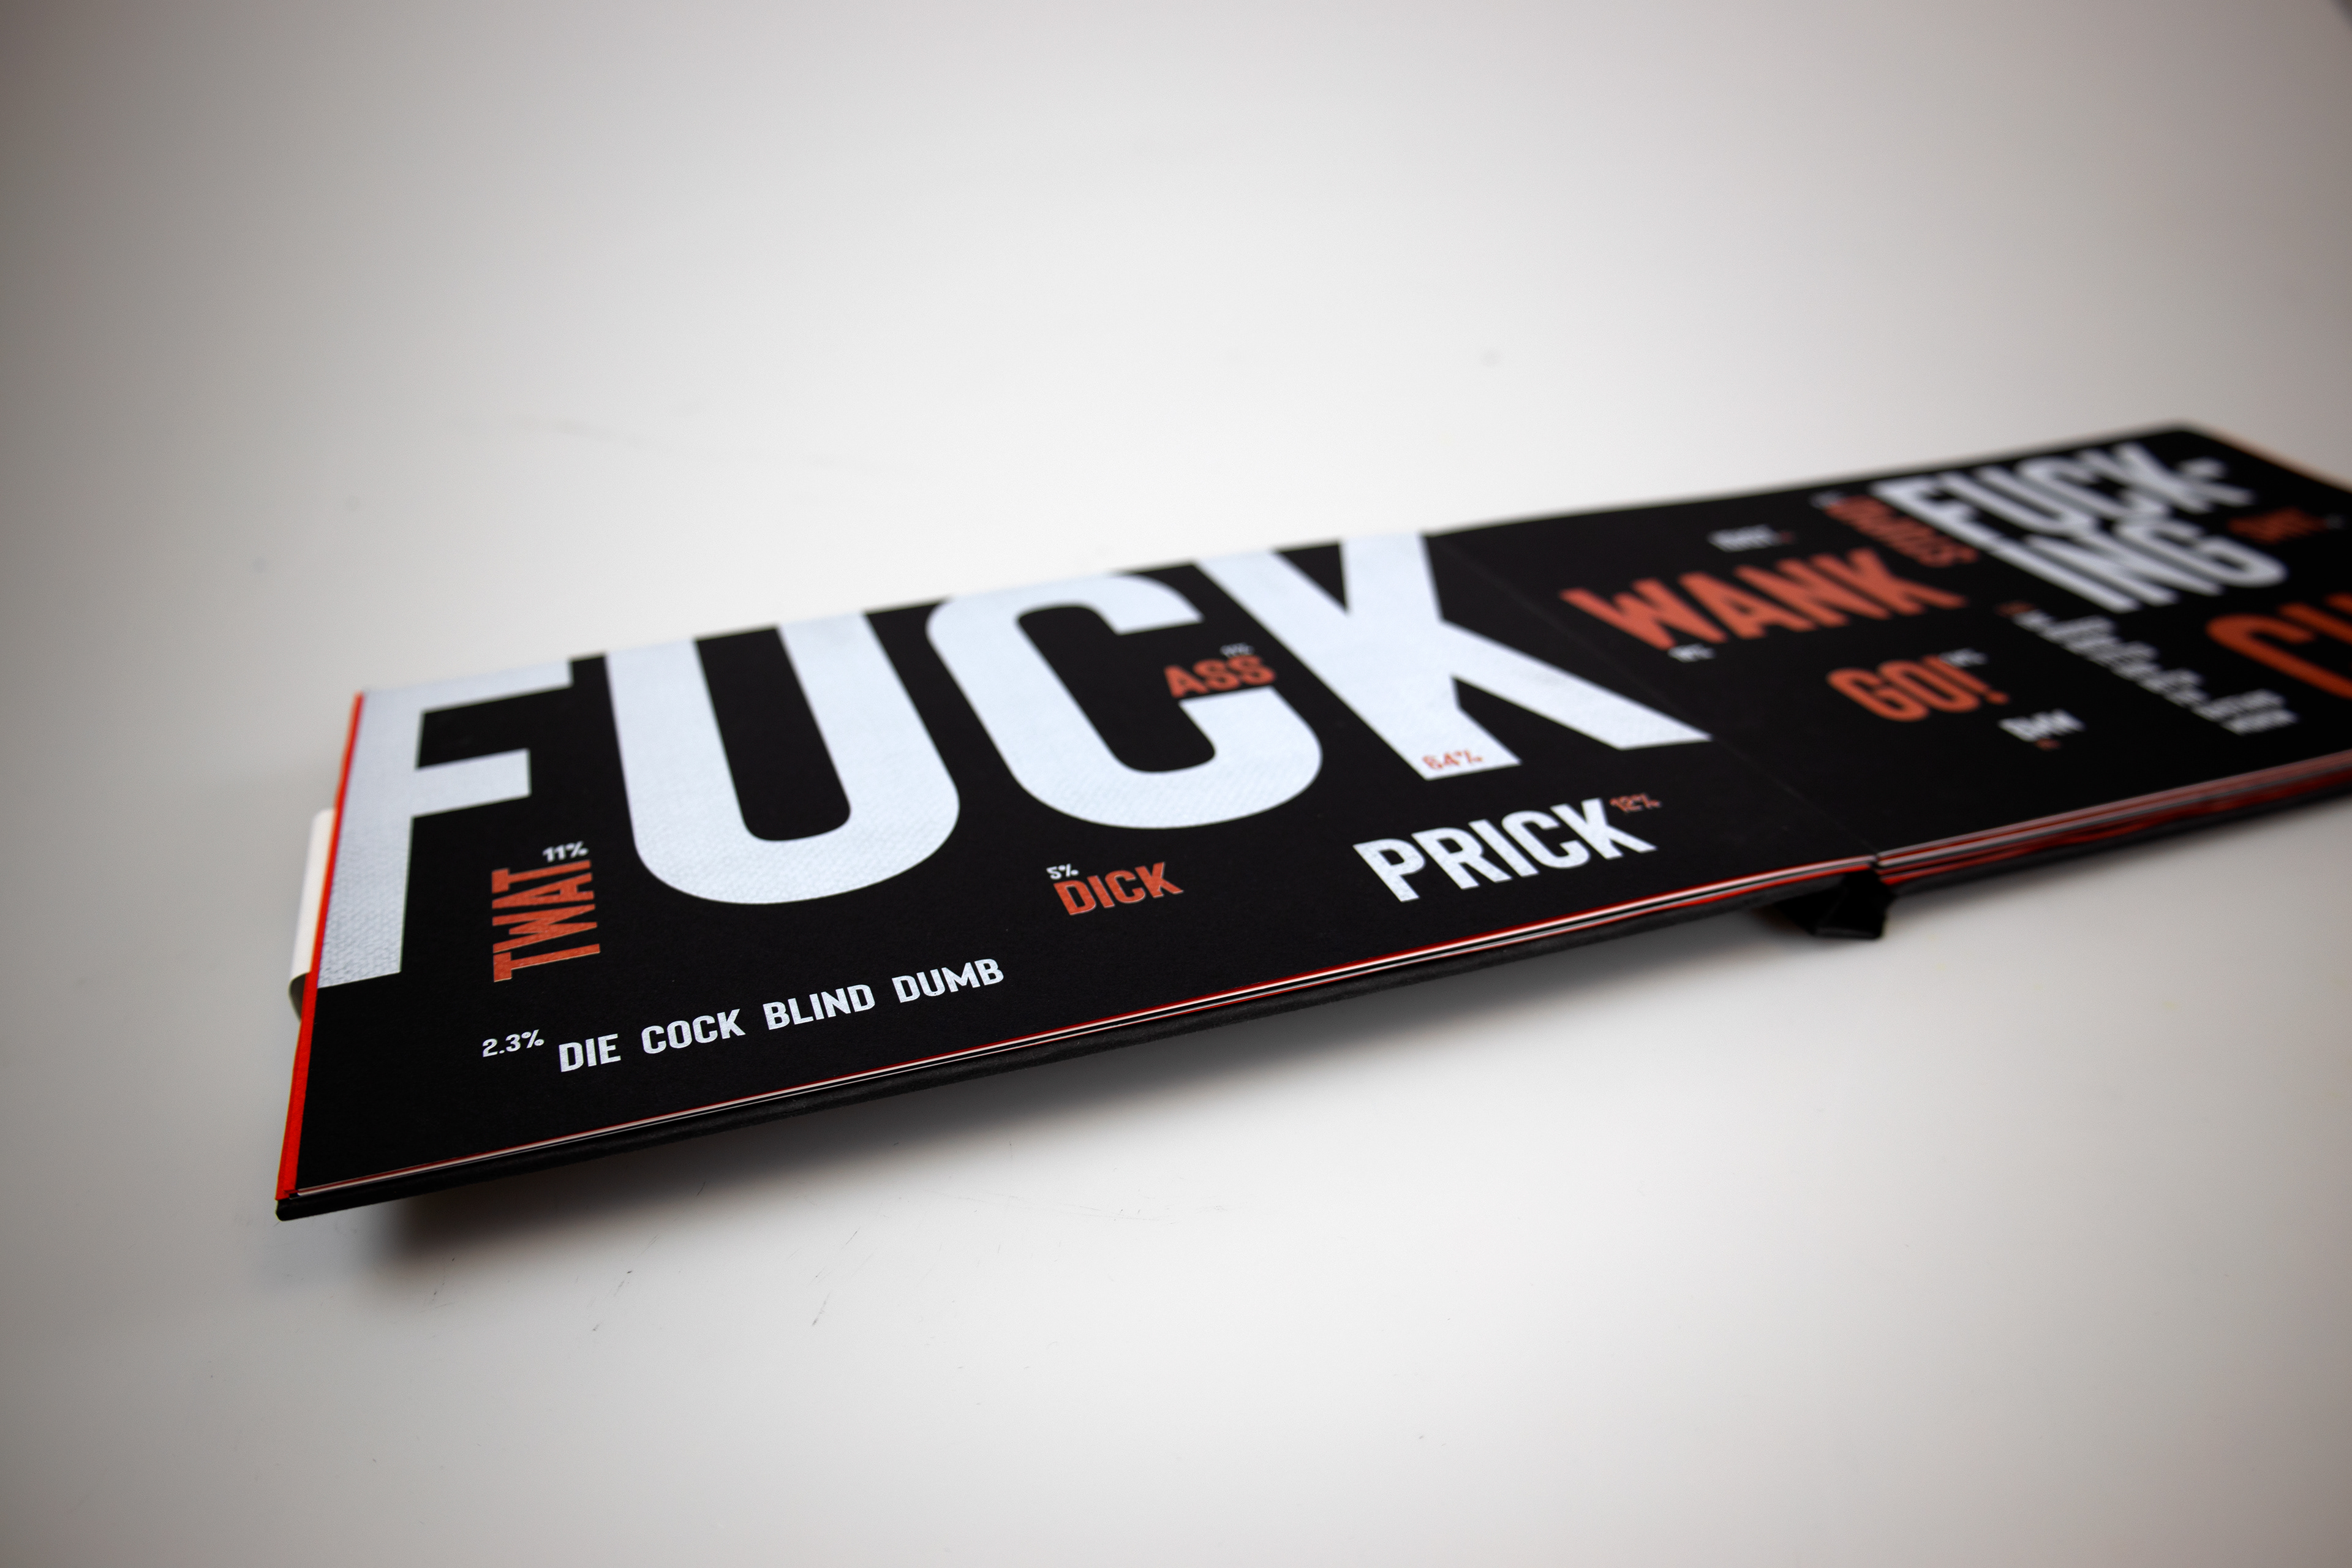
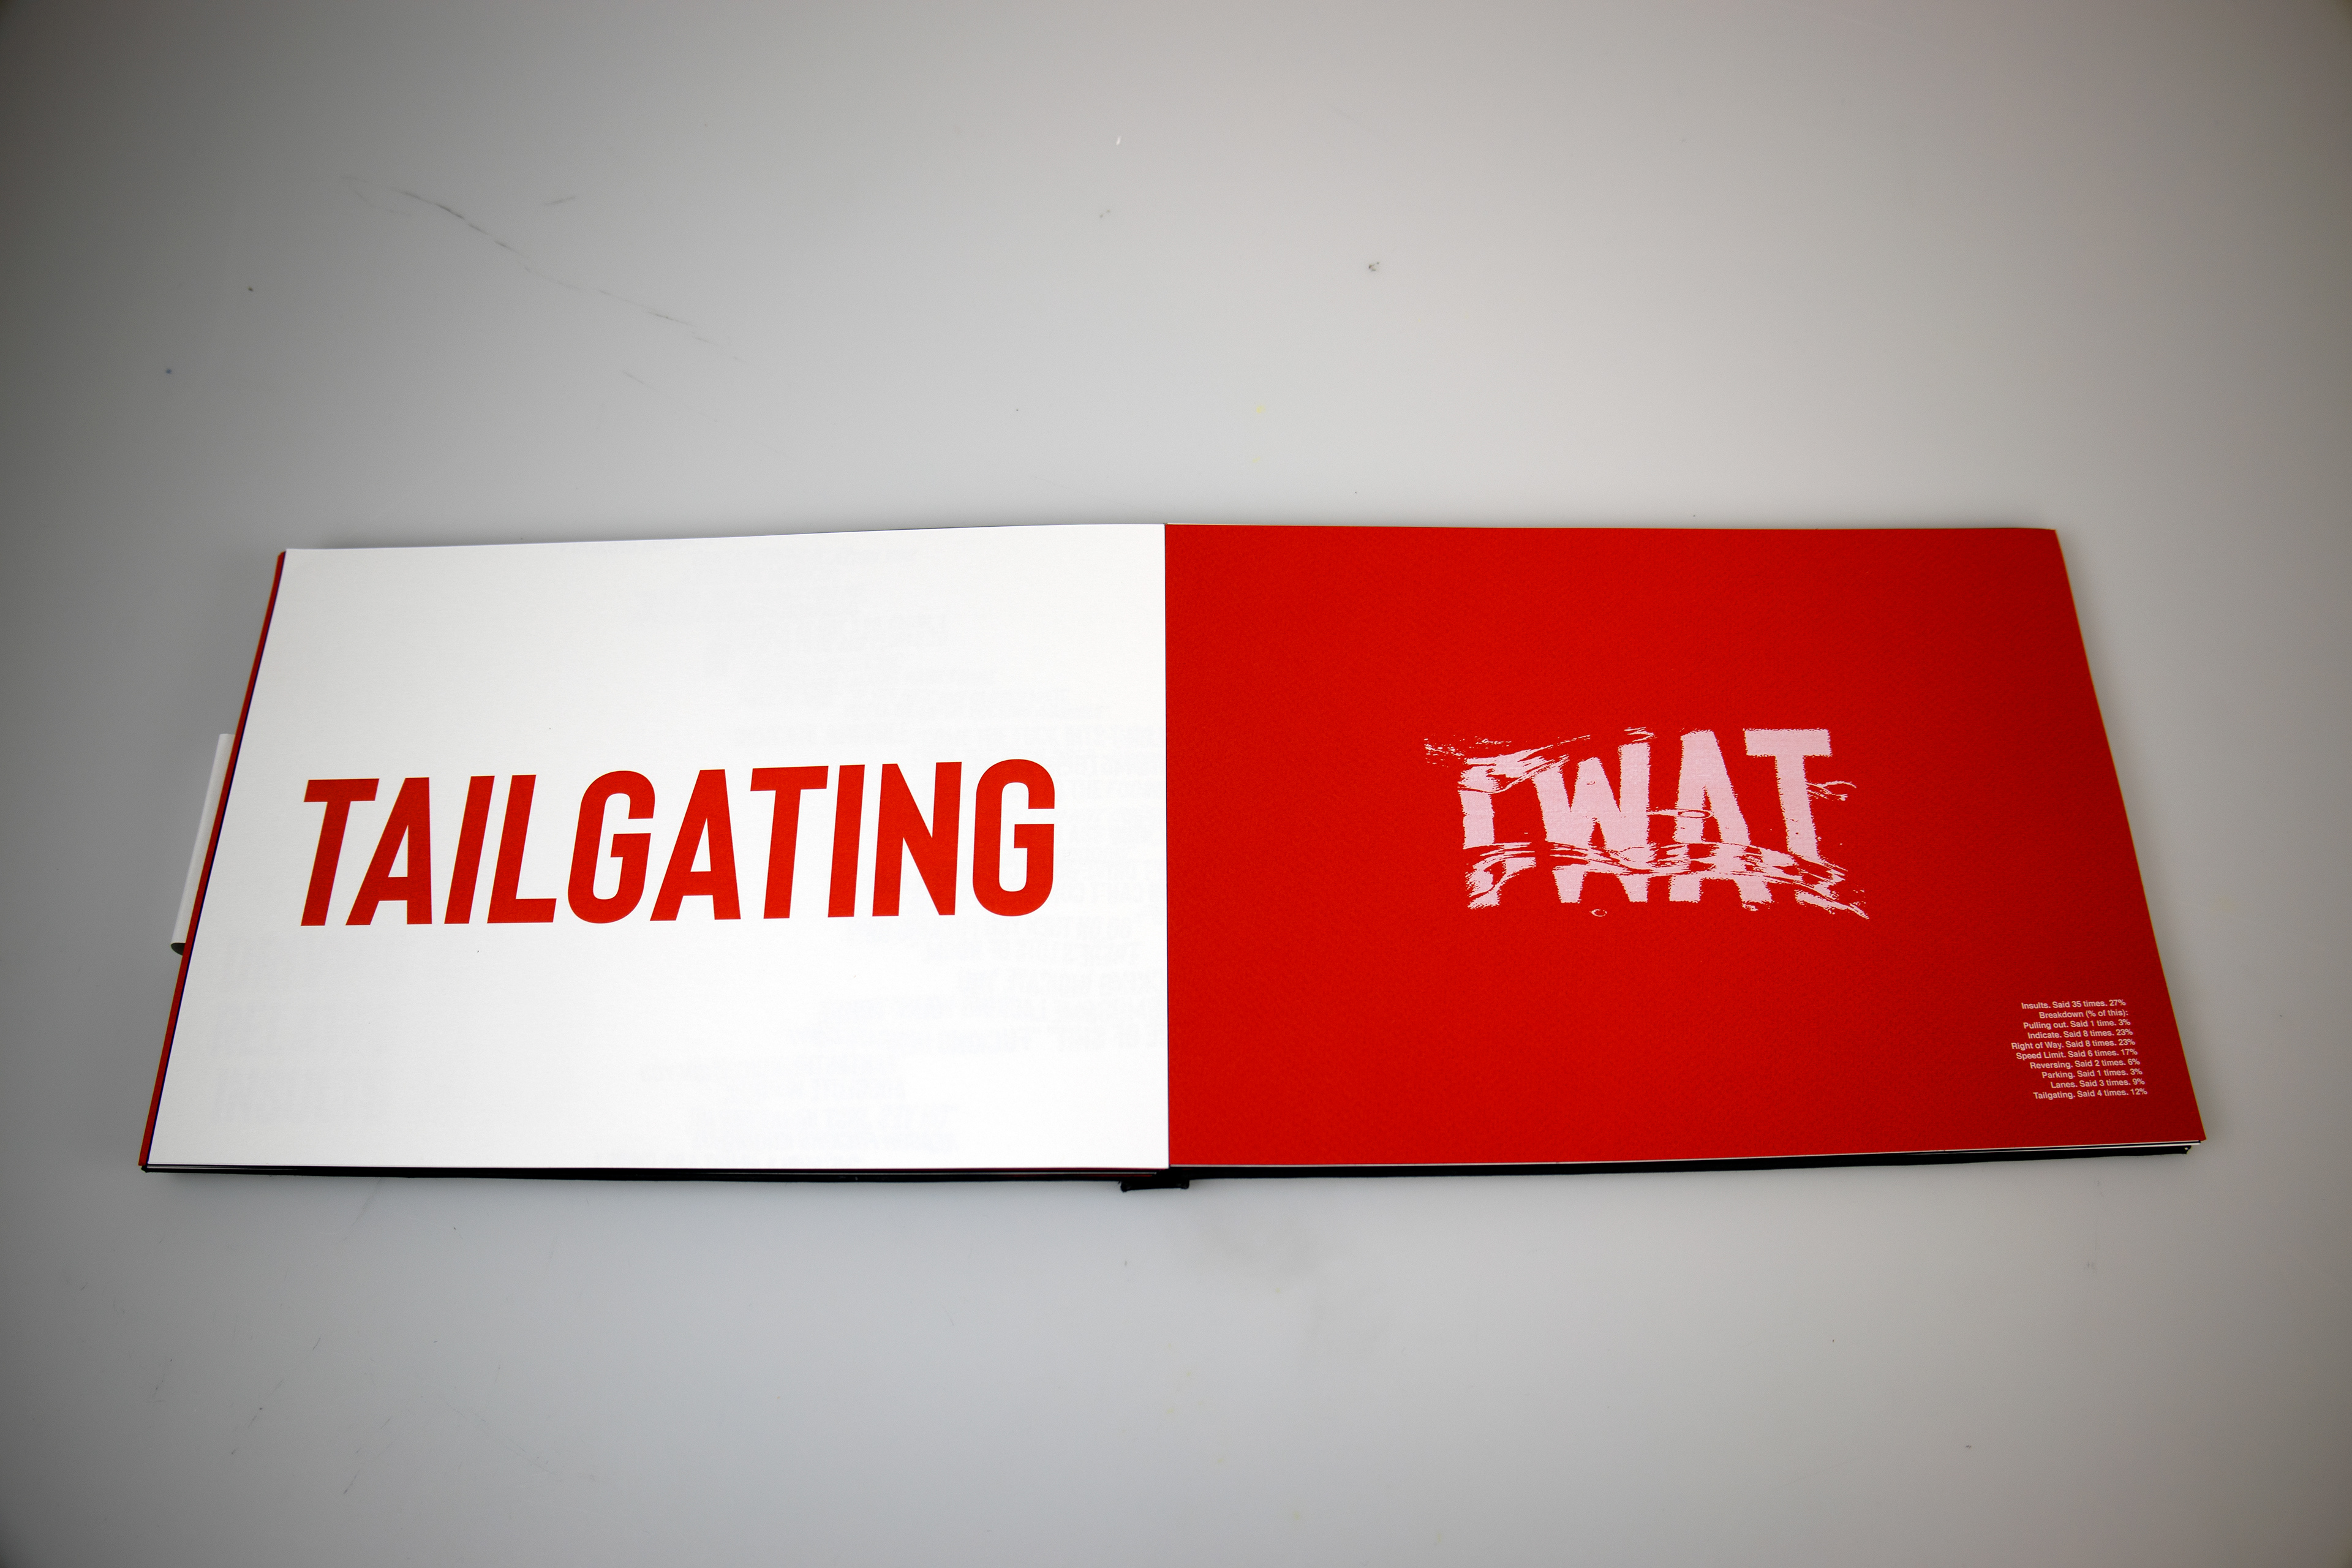
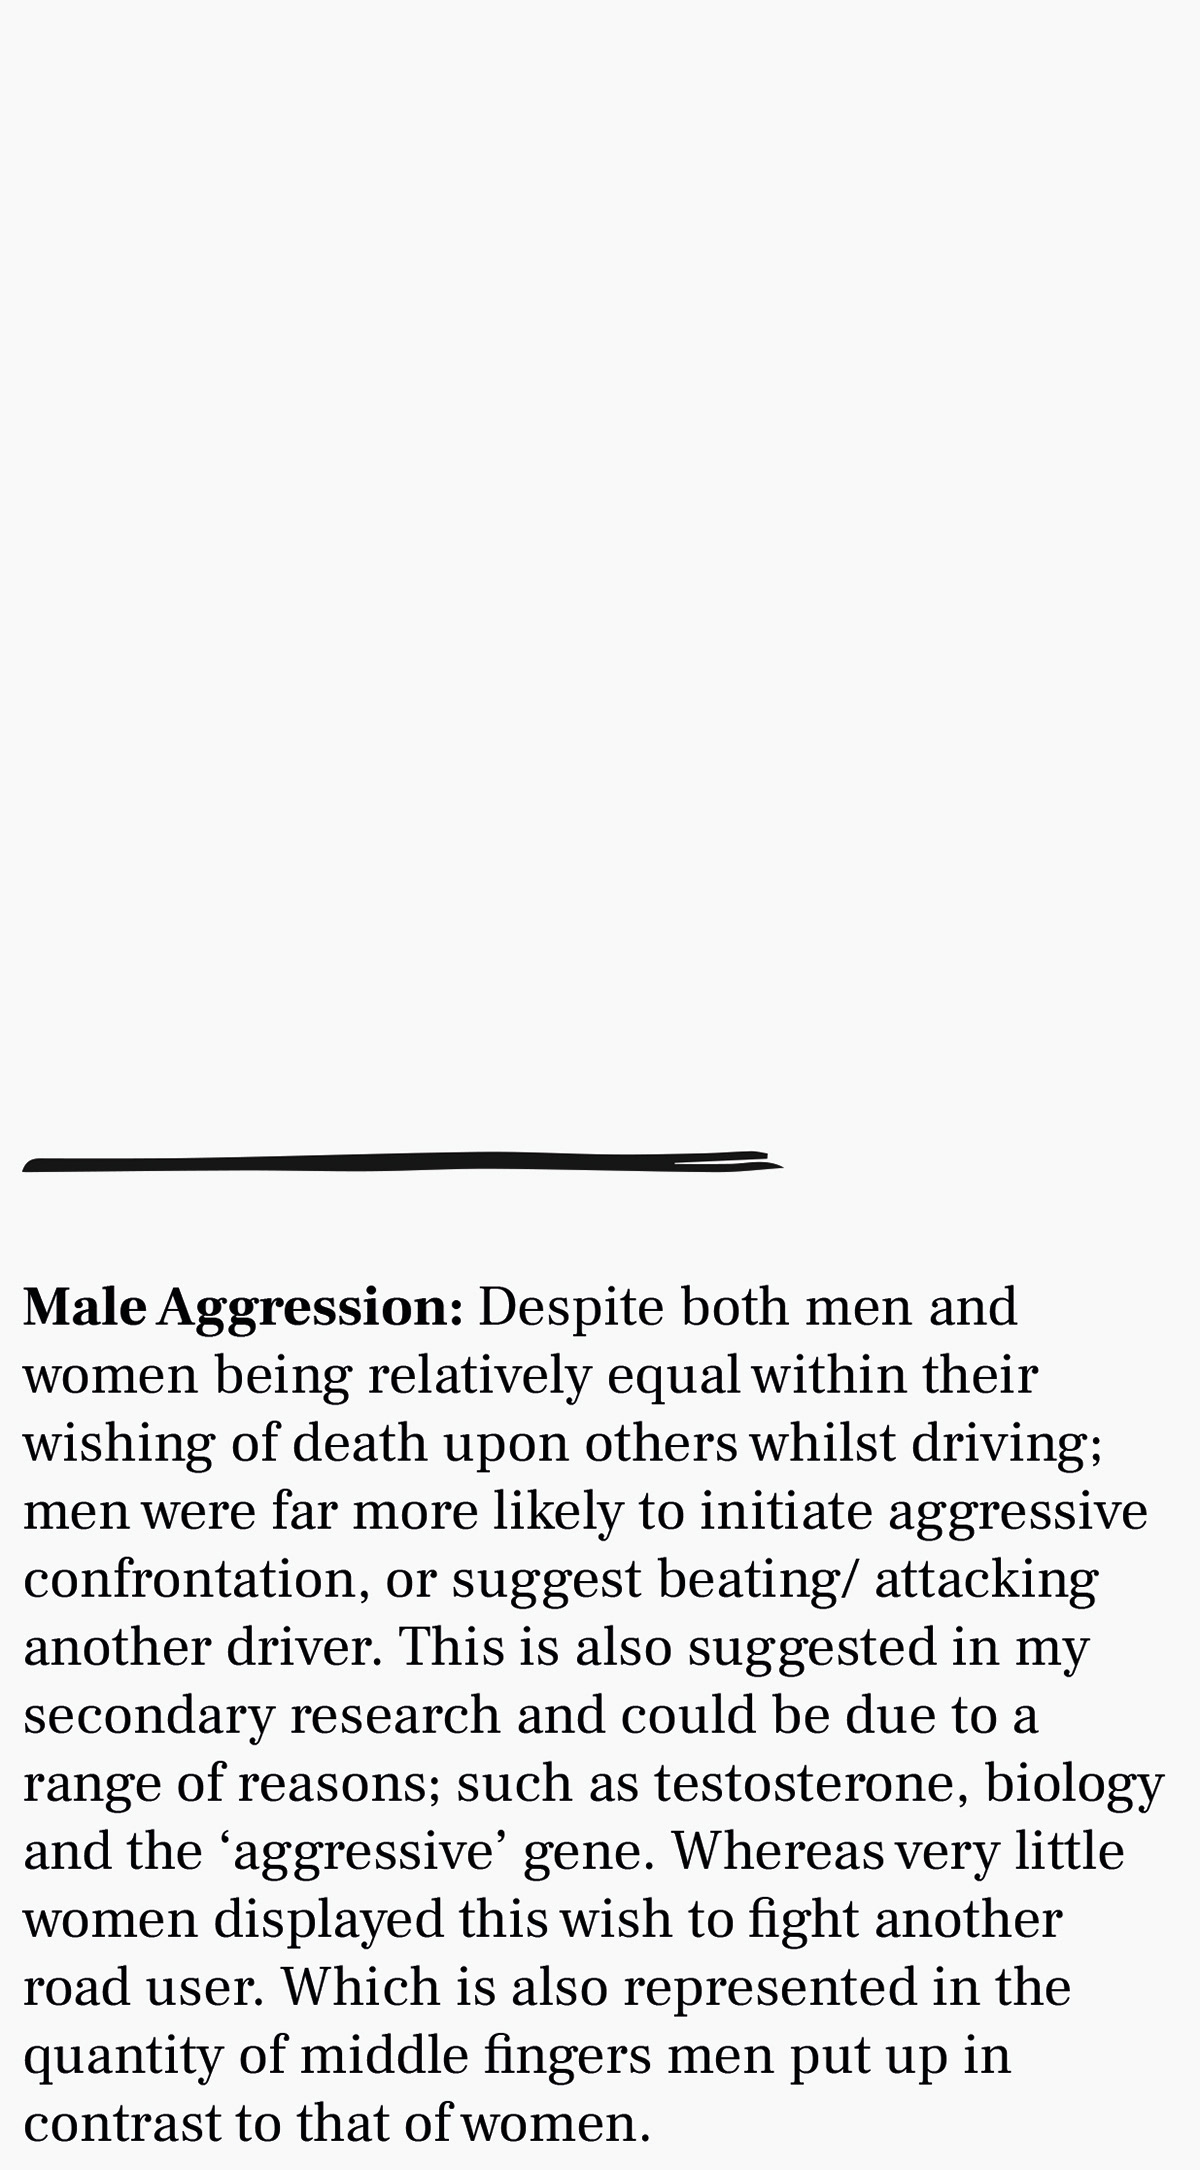
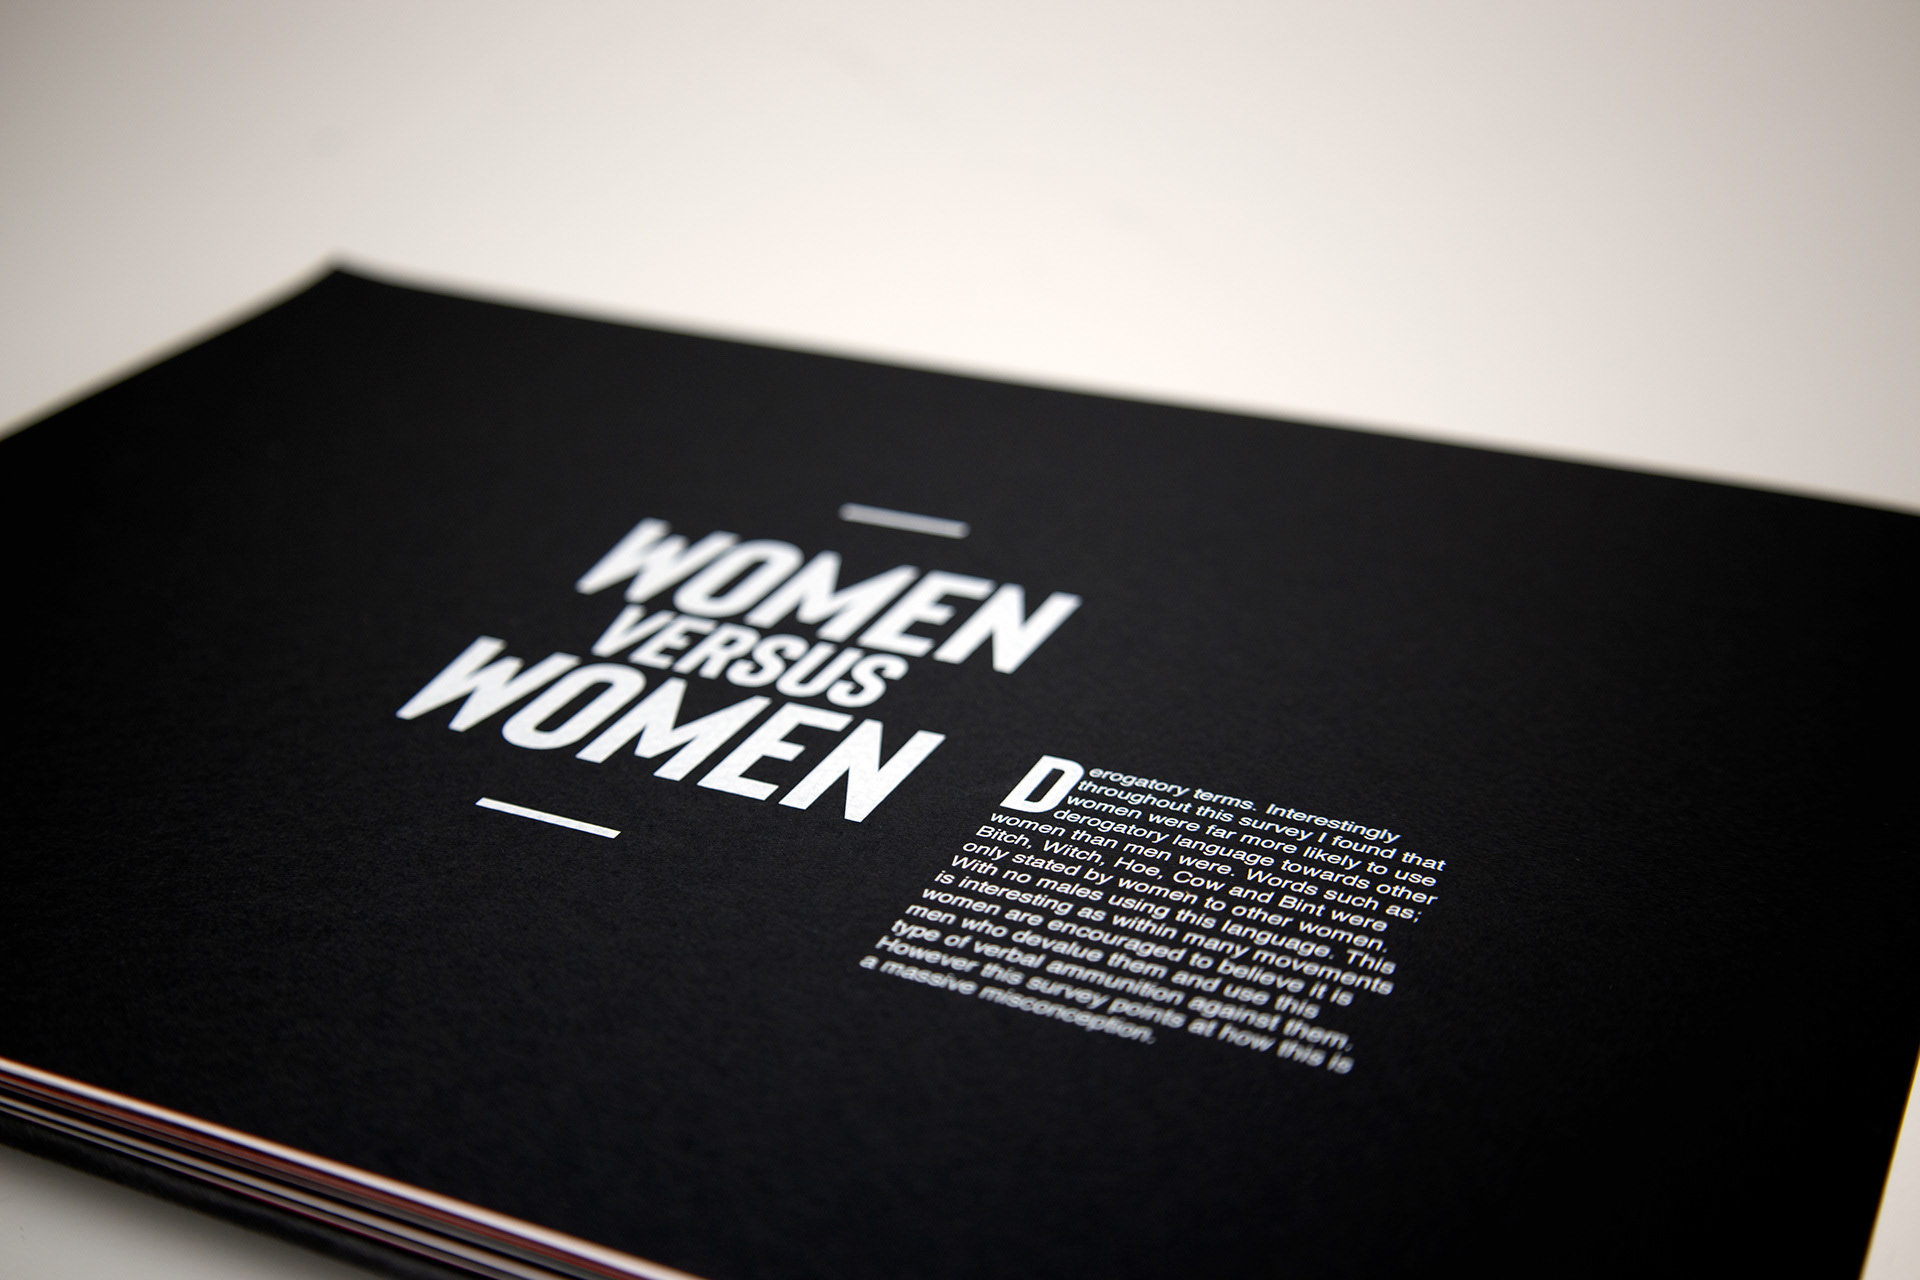
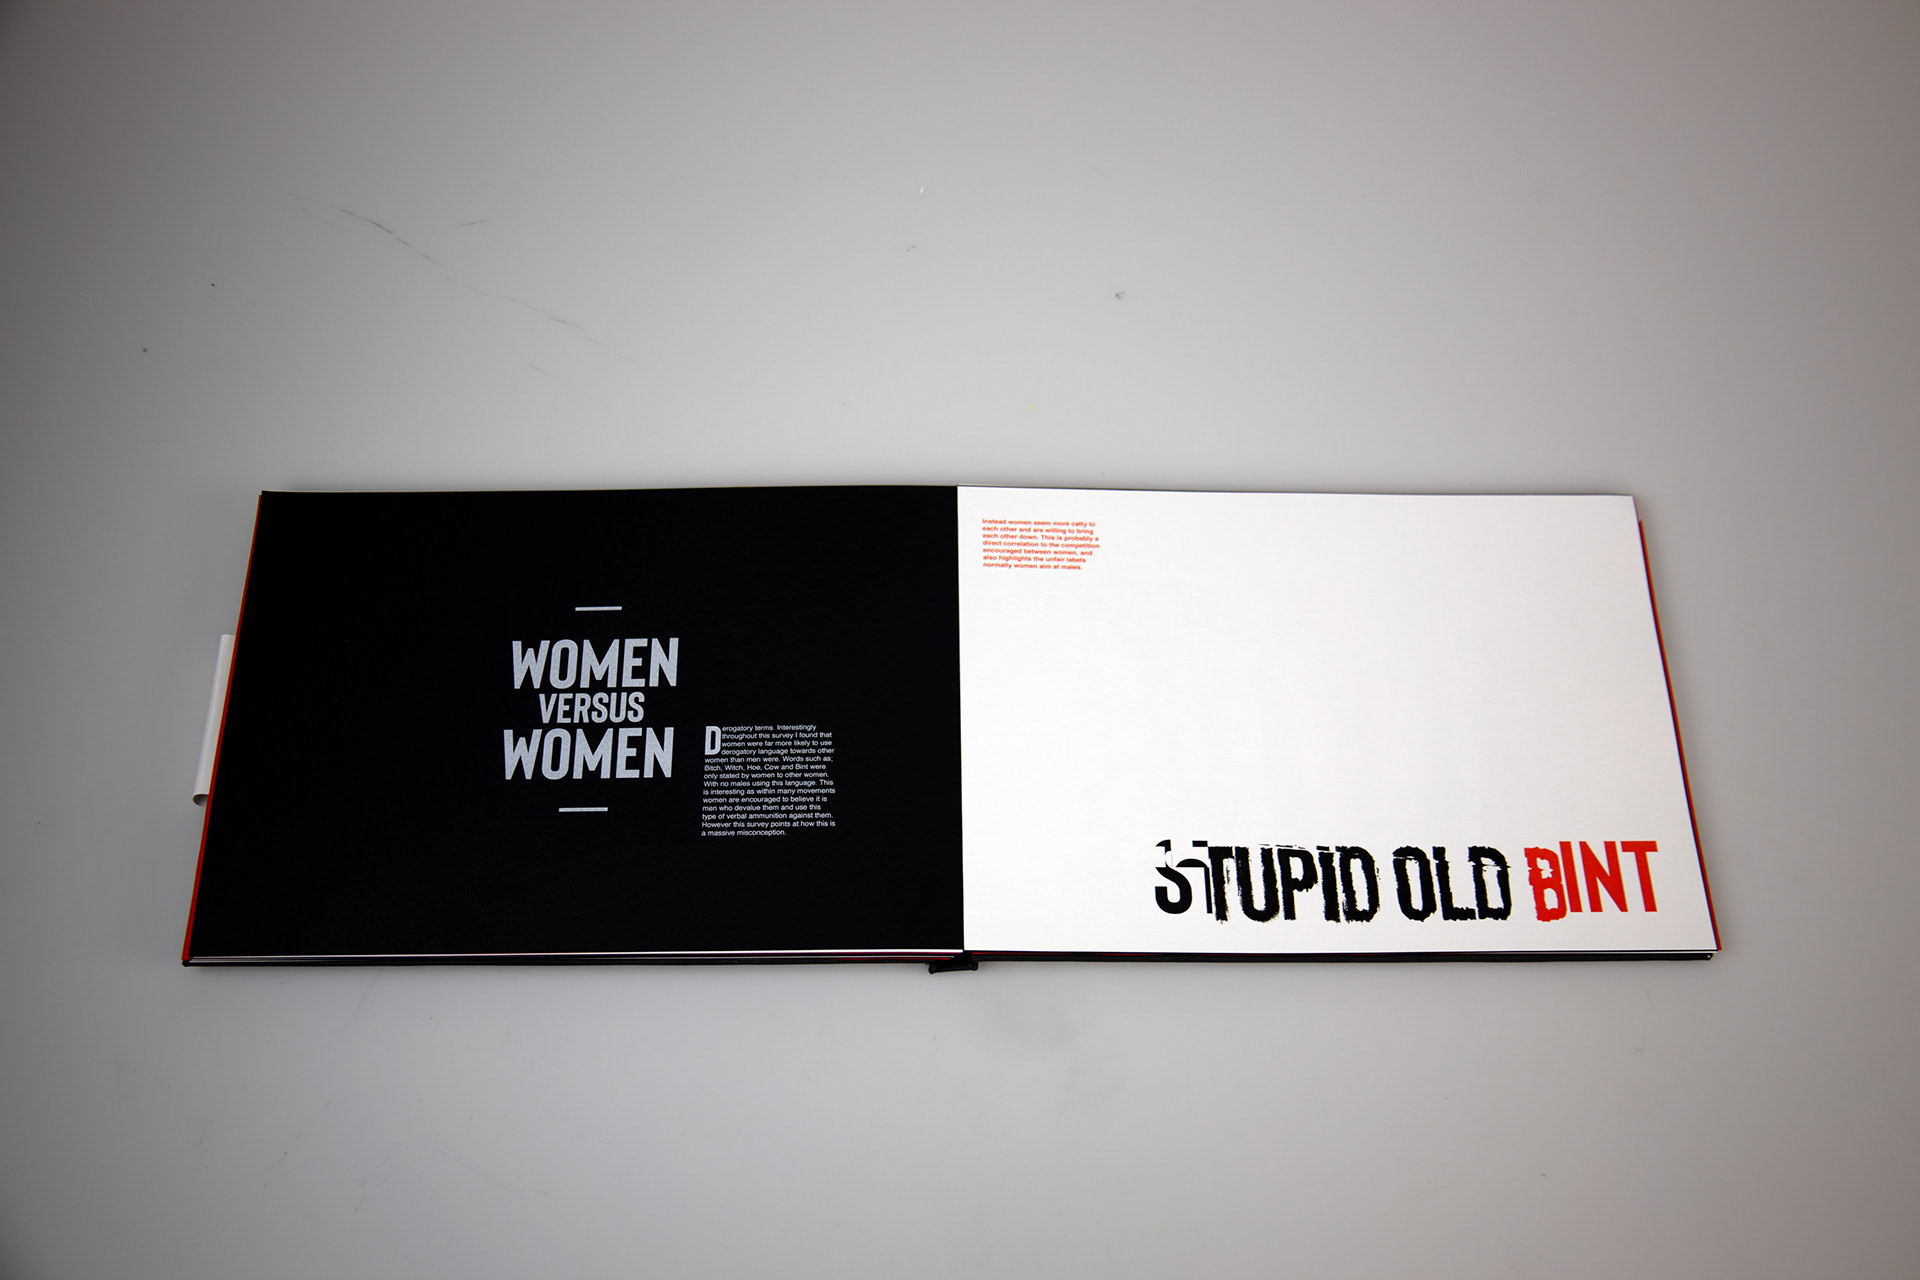
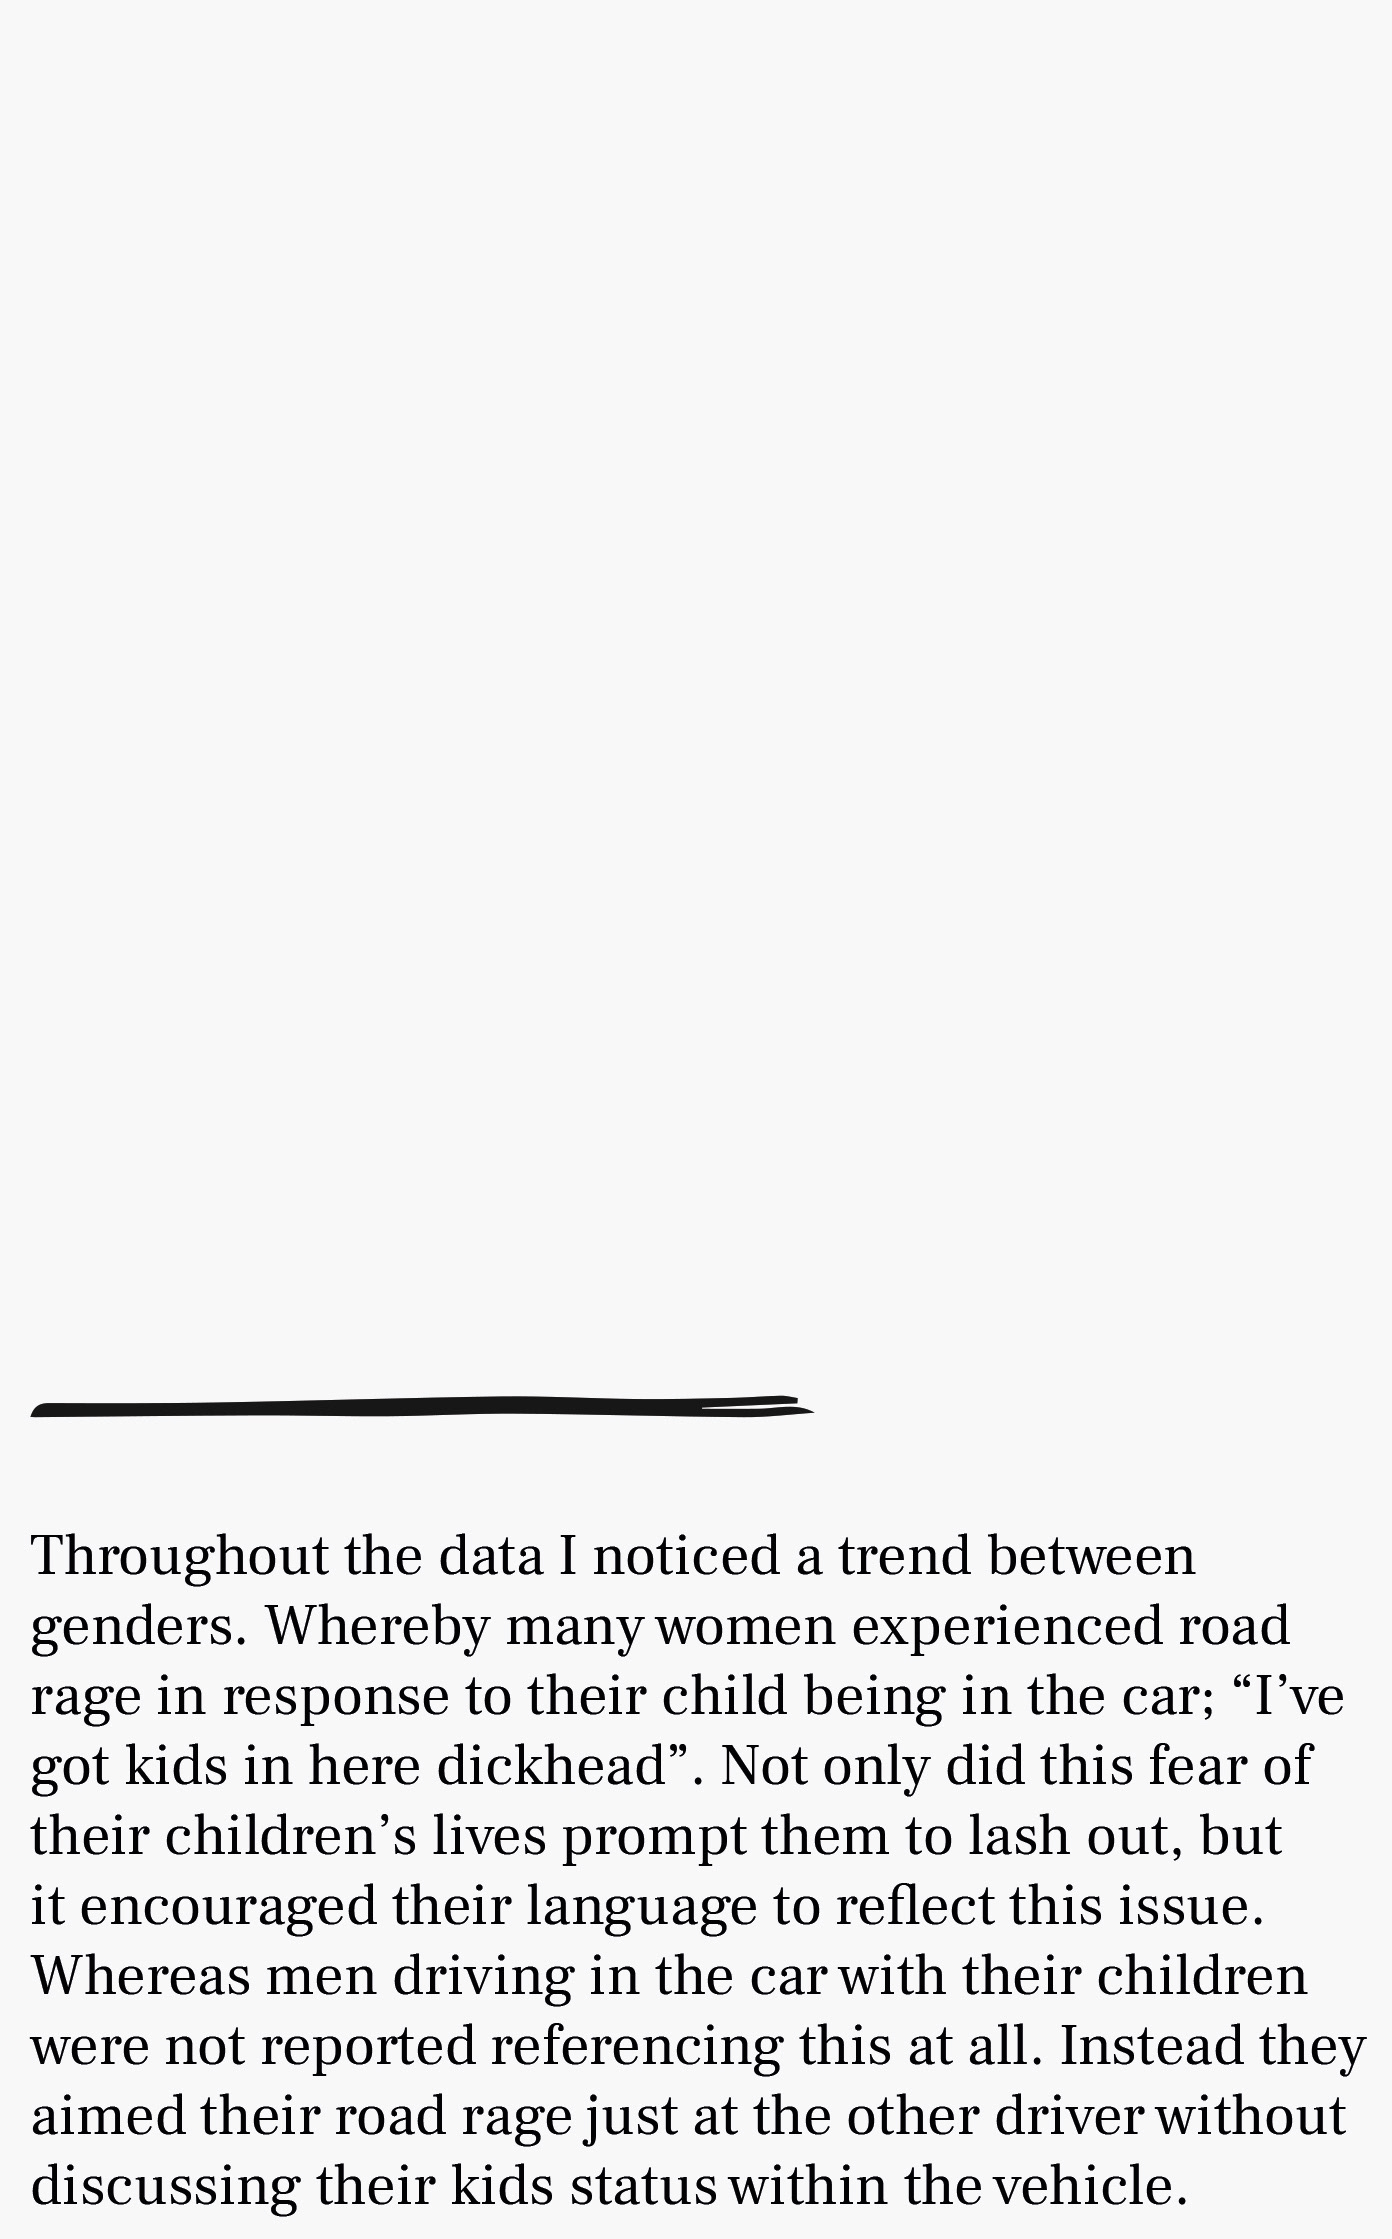
To find both quantitative and qualitative results in my gathered data I decided to go through and initially record base value points. Noting every time words were used to create a quantitative representation of language documented. From here I went back through all of the information, splitting the quotes between genders, age groups and other factors to see if there were an repeated themes or trends within the data that could result in an interesting project.I further checked this written out information and mathematics through excel formulations. Making sure only to note something when I had empirically checked it back 3 times. Once all of this information had been collected I worked out the percentage of times each word was said to create a hierarchy of information.
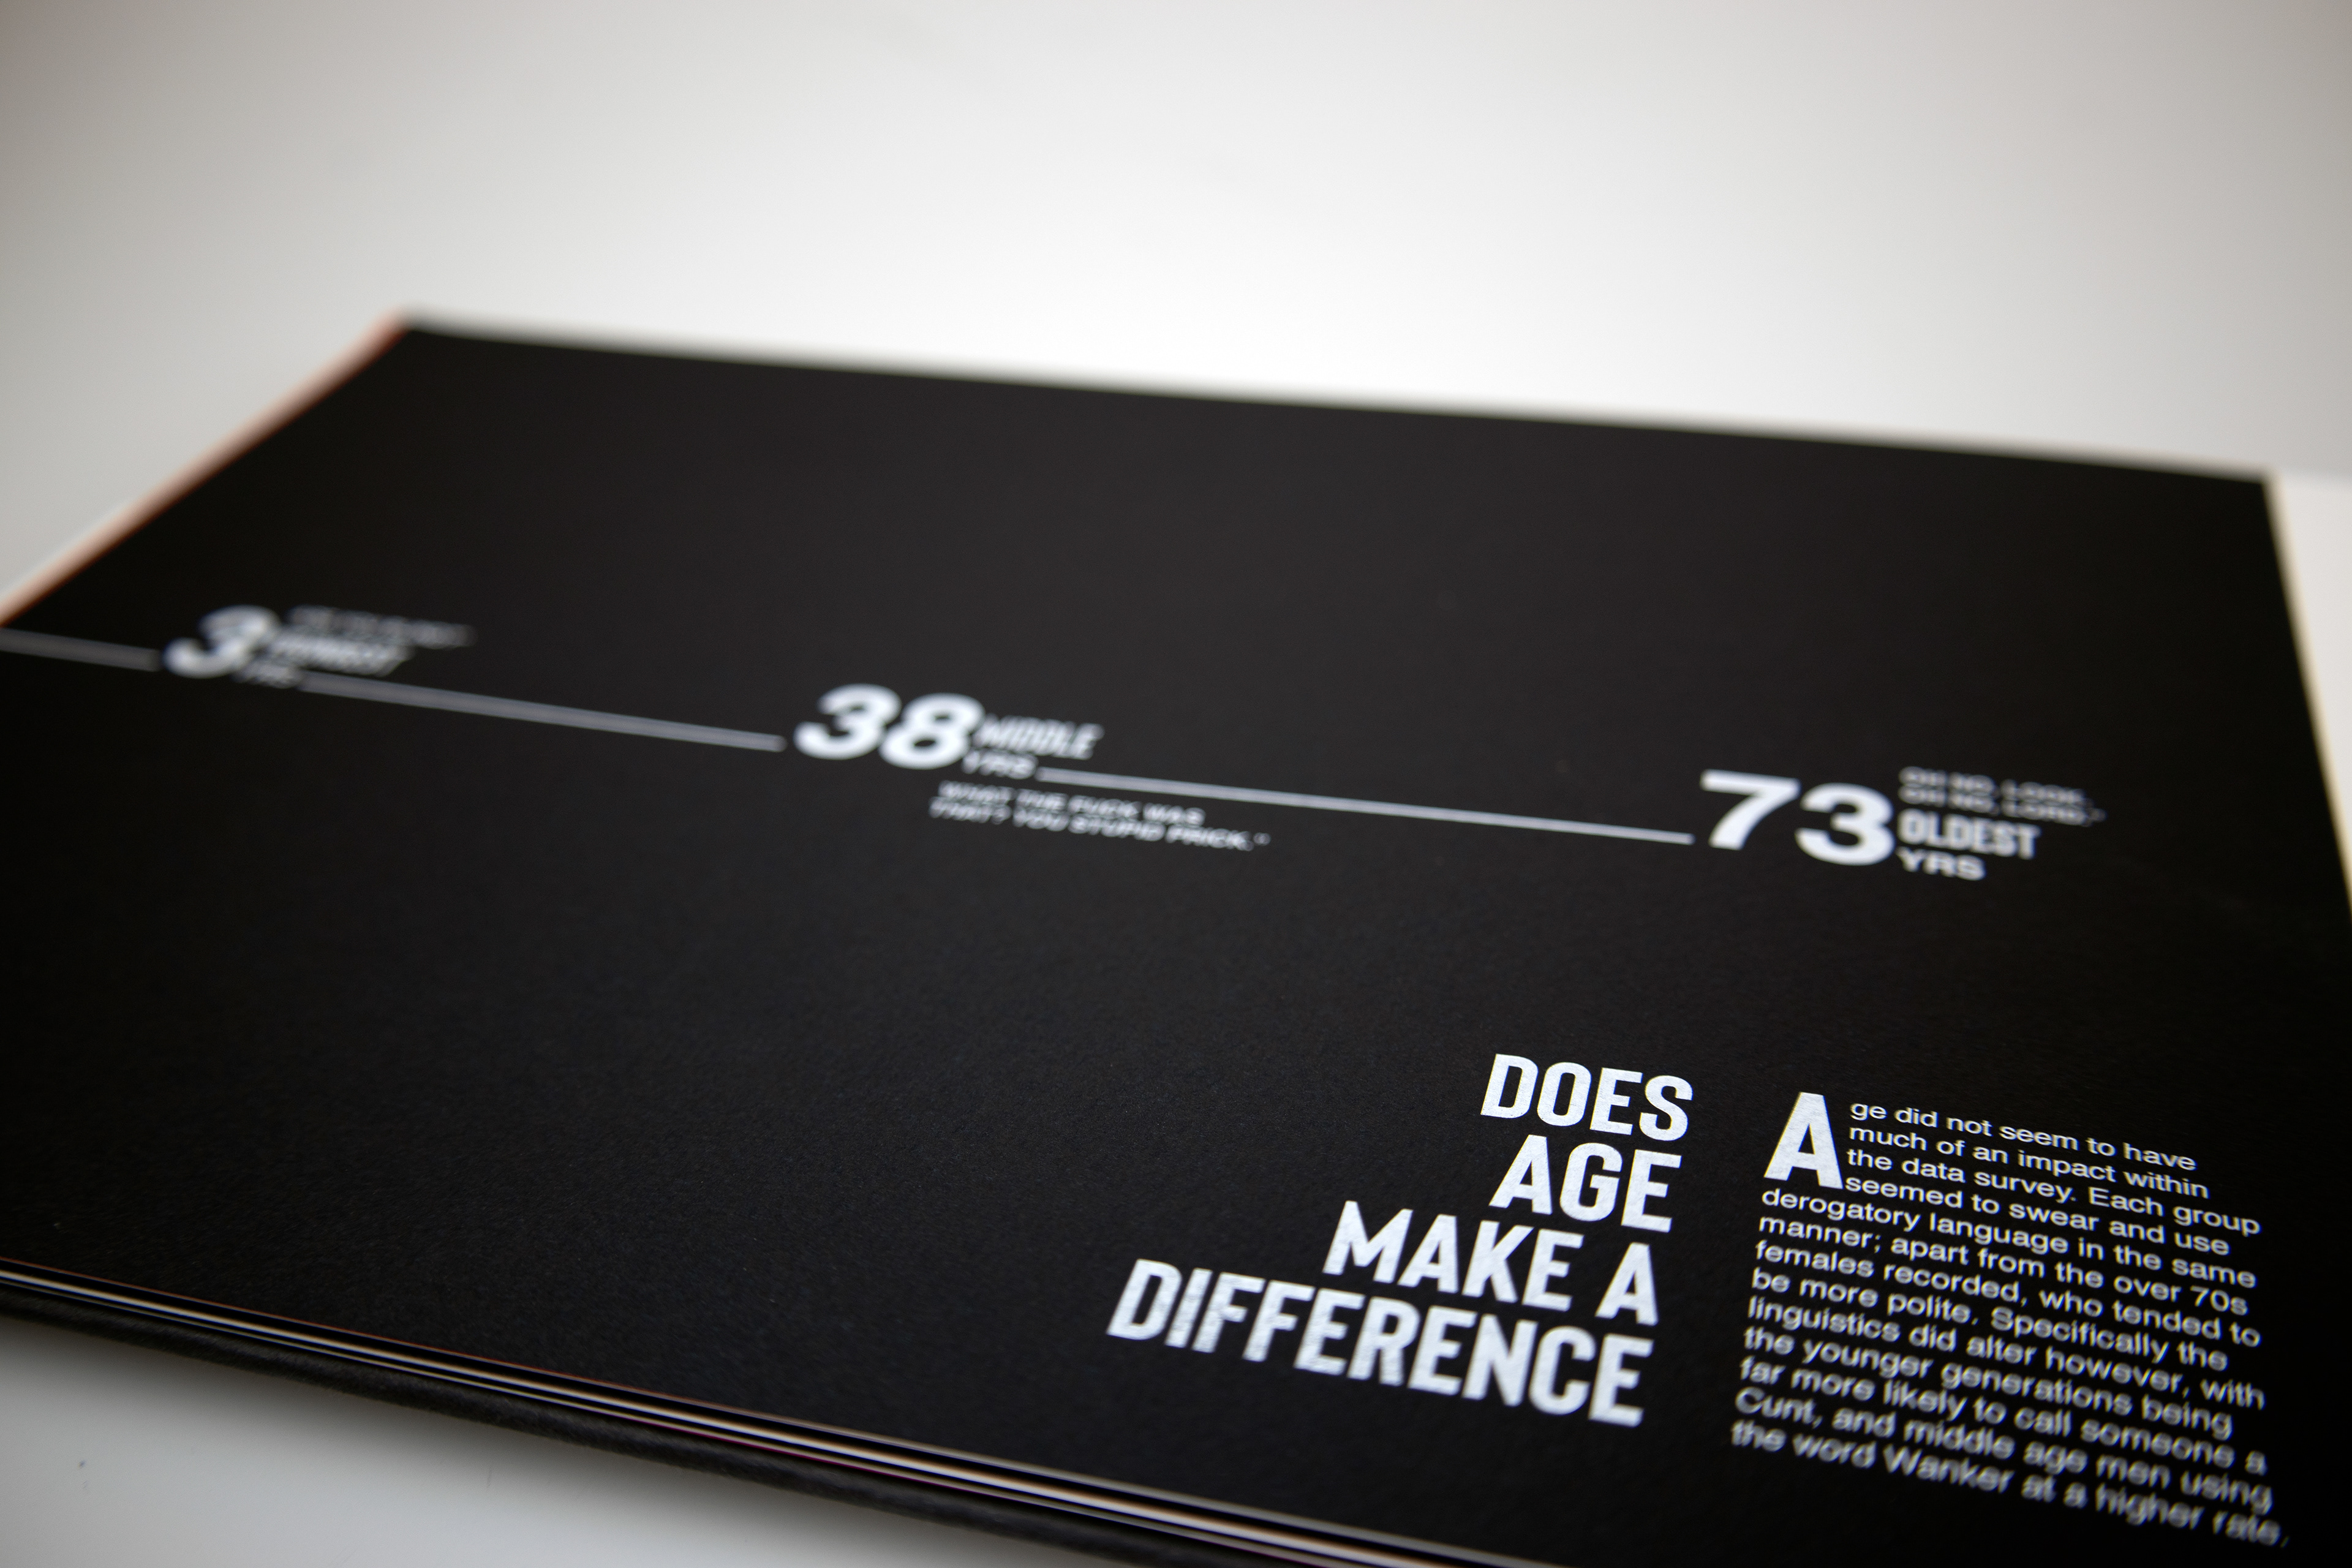
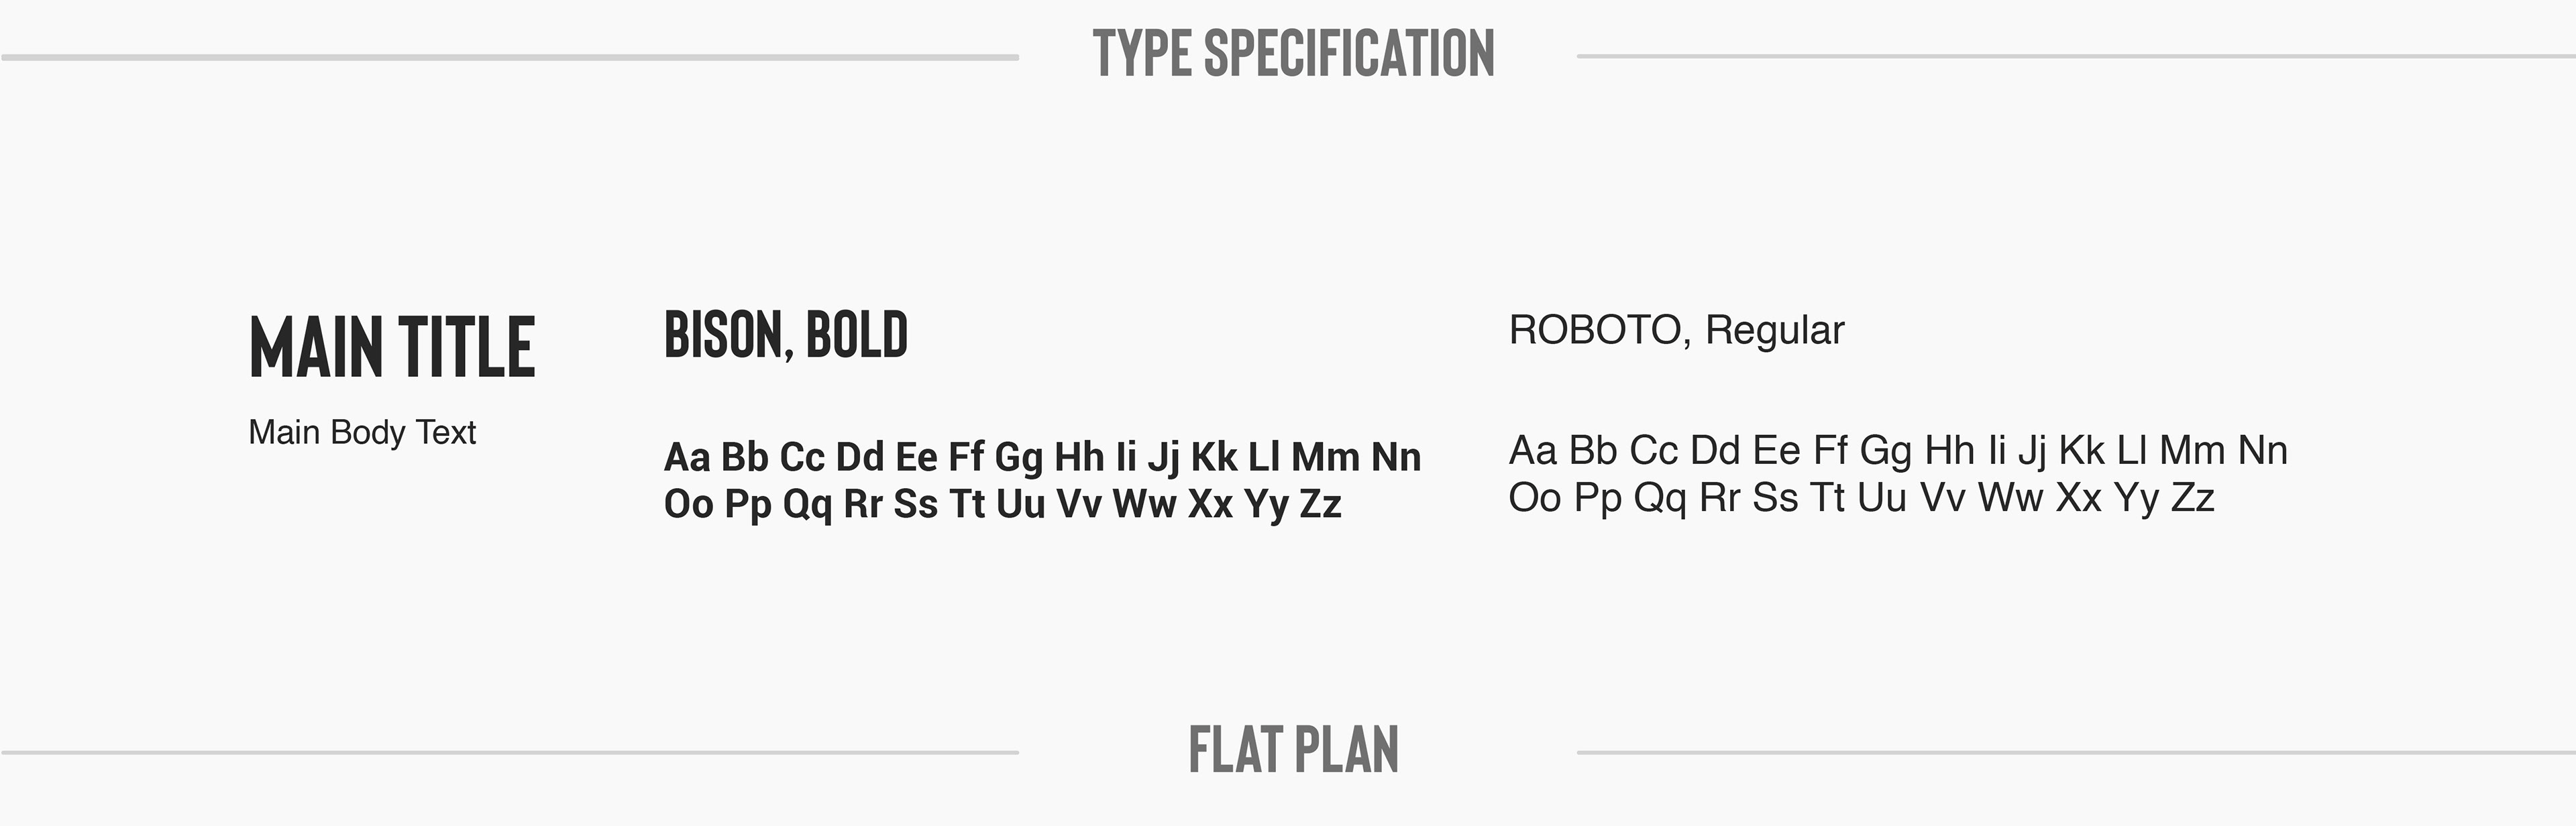
Data Analysis, Typography, Editorial